## Line Graph: Comparison of CIM-CAC and dSBM for Solving SK Instances
### Overview
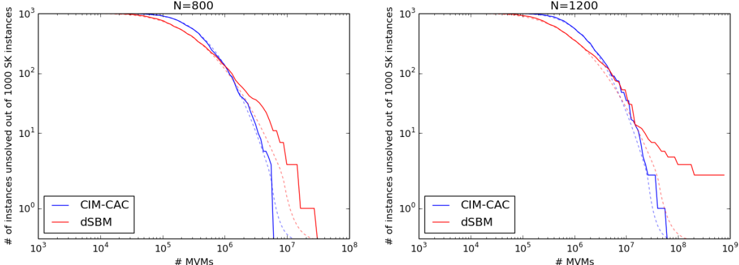
The image contains two side-by-side line graphs comparing the performance of two algorithms, **CIM-CAC** (blue) and **dSBM** (red), in solving **SK instances** for two different problem sizes: **N=800** (left graph) and **N=1200** (right graph). The y-axis represents the number of unresolved instances out of 1000 SK instances, while the x-axis represents the number of MVMs (Minimum Vertex Models). Both graphs show a logarithmic scale on both axes.
---
### Components/Axes
- **X-axis (Horizontal)**:
- Label: `# MVMs` (Minimum Vertex Models)
- Scale: Logarithmic, ranging from **10³** to **10⁸**.
- Ticks: Marked at **10³, 10⁴, 10⁵, 10⁶, 10⁷, 10⁸**.
- **Y-axis (Vertical)**:
- Label: `# instances unresolved out of 1000 SK instances`
- Scale: Logarithmic, ranging from **10⁰** to **10³**.
- Ticks: Marked at **10⁰, 10¹, 10², 10³**.
- **Legend**:
- Position: Bottom-left corner of both graphs.
- Entries:
- **Blue line**: CIM-CAC
- **Red line**: dSBM
- Additional elements: Dashed lines (possibly confidence intervals or error bounds, though not explicitly labeled).
---
### Detailed Analysis
#### Left Graph (N=800)
- **CIM-CAC (Blue)**:
- Starts near **10³ unresolved instances** at **10³ MVMs**.
- Declines sharply, reaching **~10¹ unresolved instances** by **10⁶ MVMs**.
- Further decreases to **~10⁰ unresolved instances** by **10⁷ MVMs**.
- The line is smooth and monotonically decreasing.
- **dSBM (Red)**:
- Starts near **10³ unresolved instances** at **10³ MVMs**.
- Declines more gradually than CIM-CAC, reaching **~10¹ unresolved instances** by **10⁶ MVMs**.
- Remains above CIM-CAC throughout, with a steeper drop after **10⁶ MVMs**.
#### Right Graph (N=1200)
- **CIM-CAC (Blue)**:
- Starts near **10³ unresolved instances** at **10³ MVMs**.
- Declines sharply, reaching **~10¹ unresolved instances** by **10⁶ MVMs**.
- Further decreases to **~10⁰ unresolved instances** by **10⁷ MVMs**.
- The line is smoother and more pronounced than in the N=800 case.
- **dSBM (Red)**:
- Starts near **10³ unresolved instances** at **10³ MVMs**.
- Declines more gradually than CIM-CAC, reaching **~10¹ unresolved instances** by **10⁶ MVMs**.
- Remains above CIM-CAC throughout, with a steeper drop after **10⁶ MVMs**.
---
### Key Observations
1. **CIM-CAC consistently outperforms dSBM** in both graphs, resolving more instances as the number of MVMs increases.
2. **Performance gap widens with larger N**:
- For **N=1200**, CIM-CAC resolves instances at a faster rate than for **N=800**, especially beyond **10⁶ MVMs**.
3. **Dashed lines** (likely error bounds) show variability in the data, but the trends remain consistent.
4. **Logarithmic scaling** emphasizes the exponential decay of unresolved instances for both algorithms.
---
### Interpretation
The data demonstrates that **CIM-CAC is significantly more efficient** than dSBM in solving SK instances, particularly for larger problem sizes (N=1200). The logarithmic scale highlights the exponential improvement in performance as MVMs increase. The dashed lines suggest that the results may have some variability, but the overall trend is clear. This implies that CIM-CAC could be a more scalable solution for large-scale SK problems, while dSBM may struggle with higher complexity. The graphs also indicate that the number of MVMs required to resolve instances grows exponentially with problem size, underscoring the computational challenges of SK instances.