## Diagram: Octree-GS Pipeline and Anchor Initialization
### Overview
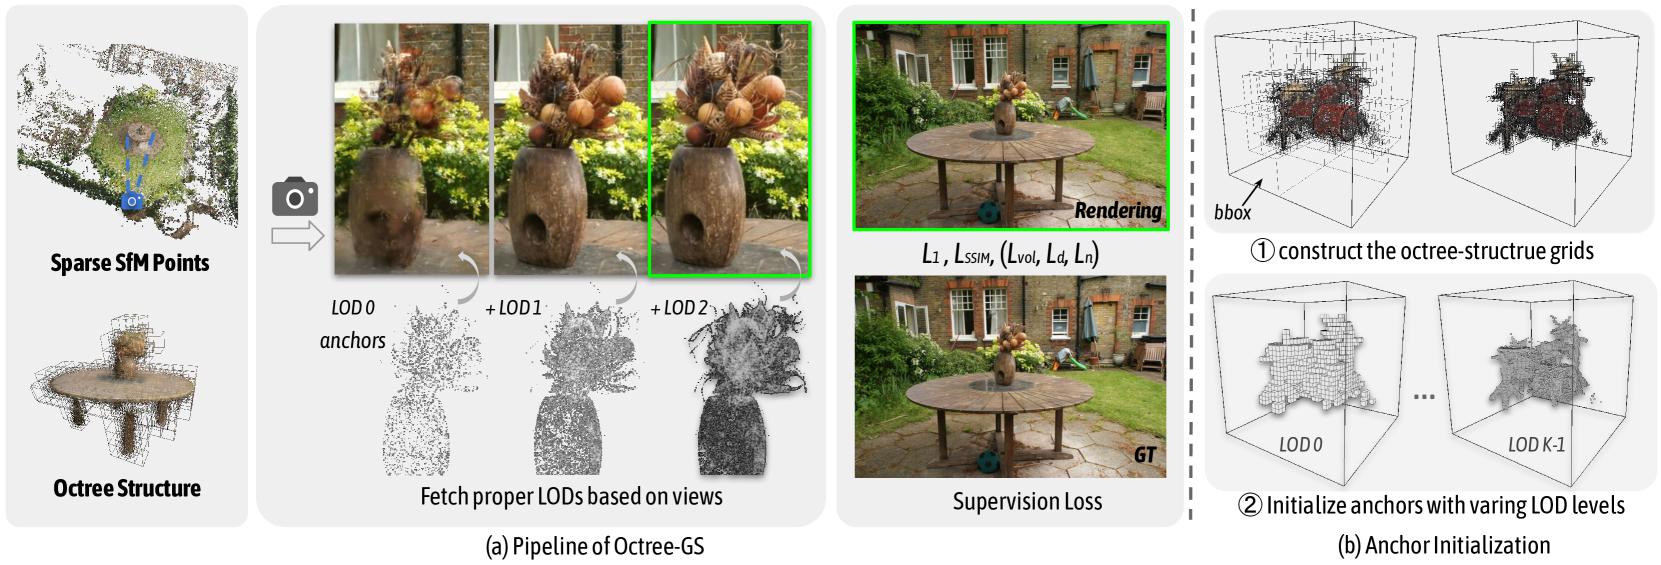
The image is a technical diagram illustrating a 3D reconstruction or rendering pipeline named "Octree-GS". It is divided into two main panels: (a) Pipeline of Octree-GS and (b) Anchor Initialization. The diagram explains a method that uses sparse Structure-from-Motion (SfM) points and an octree structure to manage Level-of-Detail (LOD) representations for efficient 3D scene rendering and supervision.
### Components/Axes
The diagram is organized into distinct visual regions:
**Left Column (Input & Structure):**
* **Top:** A point cloud visualization labeled **"Sparse SfM Points"**. It shows a sparse, colored 3D point cloud of an outdoor scene (a table with a vase in a garden). A blue camera icon with a viewing frustum is overlaid, indicating a camera pose.
* **Bottom:** A 3D model of a table and vase enclosed in a wireframe grid, labeled **"Octree Structure"**. This represents the spatial partitioning structure.
**Center Panel (a) Pipeline of Octree-GS:**
* **Top Row:** Three sequential photographic images of a vase with dried flowers on a table. The third image is highlighted with a green border. A camera icon with an arrow points to this sequence, indicating input views.
* **Middle Row:** Three point cloud visualizations corresponding to the images above, labeled **"LOD 0"**, **"LOD 1"**, and **"LOD 2"**. Below LOD 0 is the label **"anchors"**. The point density increases from LOD 0 (sparse) to LOD 2 (dense).
* **Text:** Below the LOD visualizations is the phrase **"Fetch proper LODs based on views"**.
* **Right Side of Center Panel:** Two rendered images of the full garden scene.
* The top image is labeled **"Rendering"** in its bottom-right corner. Below it are listed loss functions: **"L₁, L_{SSIM}, (L_{vol}, L_d, L_n)"**.
* The bottom image is labeled **"GT"** (Ground Truth) in its bottom-right corner.
* The text **"Supervision Loss"** is centered below these two images.
**Right Column (b) Anchor Initialization:**
* **Step 1:** A diagram showing a 3D bounding box labeled **"bbox"** containing a dense point cloud. The caption reads: **"① construct the octree-structure grids"**.
* **Step 2:** A sequence of diagrams showing progressively denser point clouds within the bounding box, from left to right. The first is labeled **"LOD 0"** and the last is labeled **"LOD K-1"**. The caption reads: **"② Initialize anchors with varying LOD levels"**.
### Detailed Analysis
The diagram details a multi-stage process:
1. **Input:** The process starts with **Sparse SfM Points** and an **Octree Structure** for spatial organization.
2. **LOD Management (Core Pipeline):** For a given set of input views (the vase images), the system fetches appropriate Level-of-Detail representations. **LOD 0** uses a sparse set of "anchors". **LOD 1** adds more points, and **LOD 2** is the densest. This suggests an adaptive detail mechanism.
3. **Rendering & Supervision:** The system produces a **Rendering** of the full scene. This rendering is supervised by comparing it to the **GT** (Ground Truth) image using a composite loss function: **L₁** (likely L1 loss), **L_{SSIM}** (Structural Similarity Index Measure loss), and a set of volumetric/density losses **(L_{vol}, L_d, L_n)**.
4. **Anchor Initialization (Sub-process):** This explains how the LOD anchors are created. First, an octree grid is constructed within a bounding box (**bbox**). Then, anchors are initialized at different LOD levels, from the coarsest (**LOD 0**) to the finest (**LOD K-1**).
### Key Observations
* The **LOD visualization** shows a clear trend of increasing point density from LOD 0 to LOD 2, correlating with finer detail.
* The **"anchors"** label is specifically associated with the sparsest LOD (LOD 0), indicating they are the foundational points for the representation.
* The **supervision loss** is applied by comparing a full-scene rendering to a ground truth photograph, not just the object (vase).
* The **green border** around the third input image and the "Rendering" image may indicate they are the primary view or the target for the illustrated step.
* The process is hierarchical, moving from sparse inputs and coarse structures to dense, supervised renderings.
### Interpretation
This diagram outlines a method for efficient neural rendering or 3D reconstruction, likely for large-scale scenes. The core innovation appears to be the use of an **octree-structured grid** to manage **Level-of-Detail (LOD) anchors**. Instead of using a uniform representation, the system adaptively fetches the appropriate LOD (from sparse anchors to dense points) based on the camera view. This is a common strategy to balance computational efficiency with rendering quality.
The **anchor initialization** process (b) is crucial for building this multi-resolution representation. By constructing an octree and seeding anchors at different levels, the system creates a foundation that can represent both coarse geometry and fine details. The **supervision loss** (a) ensures that the final rendering, built from these LOD components, matches real-world photographs. The inclusion of both pixel-wise (L₁) and perceptual (L_{SSIM}) losses, along with volumetric terms, suggests a focus on producing visually plausible and structurally accurate 3D scenes.
In essence, the pipeline translates sparse 3D points into a detailed, renderable scene representation by intelligently managing complexity through a hierarchical octree and LOD system, all trained via direct image supervision.