## Chart: Accuracy on Dev Set vs. Number of Training Examples
### Overview
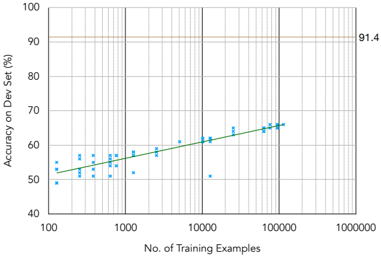
The image is a scatter plot showing the relationship between the accuracy on a development set (Dev Set) and the number of training examples used. The x-axis is logarithmic, representing the number of training examples, and the y-axis represents the accuracy on the Dev Set in percentage. A trend line is fitted to the scatter plot. A horizontal line is drawn at 91.4% accuracy.
### Components/Axes
* **X-axis:** "No. of Training Examples" (logarithmic scale). The axis markers are at 100, 1000, 10000, 100000, and 1000000.
* **Y-axis:** "Accuracy on Dev Set (%)". The axis markers are at 40, 50, 60, 70, 80, 90, and 100.
* **Data Points:** Blue 'x' markers represent individual data points.
* **Trend Line:** A green line shows the general trend of the data.
* **Horizontal Line:** A horizontal line at y = 91.4.
### Detailed Analysis
* **X-Axis Values:** The x-axis is a logarithmic scale.
* **Y-Axis Values:** The y-axis represents the accuracy on the Dev Set, ranging from 40% to 100%.
* **Data Points:** The blue 'x' markers are scattered across the plot.
* At 100 training examples, the accuracy ranges approximately from 49% to 58%.
* At 1000 training examples, the accuracy ranges approximately from 52% to 59%.
* At 10000 training examples, the accuracy ranges approximately from 58% to 65%.
* At 100000 training examples, the accuracy ranges approximately from 64% to 66%.
* **Trend Line:** The green trend line slopes upward, indicating a positive correlation between the number of training examples and the accuracy on the Dev Set.
* **Horizontal Line:** A horizontal line is present at 91.4% accuracy.
### Key Observations
* The accuracy on the Dev Set generally increases as the number of training examples increases.
* The rate of increase in accuracy appears to diminish as the number of training examples increases, suggesting diminishing returns.
* There is a significant amount of variance in the accuracy for a given number of training examples.
### Interpretation
The chart suggests that increasing the number of training examples generally improves the accuracy of the model on the development set. However, the improvement in accuracy diminishes as the number of training examples increases, indicating that there may be a point of diminishing returns. The scatter of the data points indicates that other factors besides the number of training examples also influence the accuracy on the Dev Set. The horizontal line at 91.4% may represent a target accuracy or a performance benchmark.