\n
## Chart: Learning Curves - Accuracy vs. Training Examples
### Overview
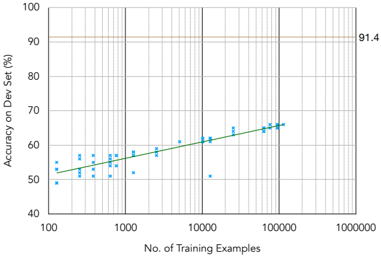
The image presents a learning curve chart illustrating the relationship between the number of training examples and the accuracy achieved on a development (dev) set. The chart displays a scatter plot of individual data points, along with a green line representing a trendline. A horizontal line indicates a maximum accuracy level.
### Components/Axes
* **X-axis:** "No. of Training Examples" - Logarithmic scale, ranging from 100 to 1000000 (1 million). Tick marks are present at 100, 1000, 10000, 100000, and 1000000.
* **Y-axis:** "Accuracy on Dev Set (%)" - Linear scale, ranging from 40% to 100%. Tick marks are present at 40%, 50%, 60%, 70%, 80%, 90%, and 100%.
* **Data Points:** Blue 'x' markers representing individual accuracy measurements for different numbers of training examples.
* **Trendline:** A solid green line representing the overall trend of accuracy as the number of training examples increases.
* **Horizontal Line:** A thin, tan horizontal line at approximately 91.4% accuracy.
* **Gridlines:** Vertical gridlines are present to aid in reading values on the x-axis. Horizontal gridlines are present to aid in reading values on the y-axis.
### Detailed Analysis
The trendline slopes upward, indicating that as the number of training examples increases, the accuracy on the dev set generally increases.
* **Data Point Distribution:**
* At 100 training examples, accuracy ranges from approximately 48% to 56%.
* At 1000 training examples, accuracy ranges from approximately 54% to 64%.
* At 10000 training examples, accuracy ranges from approximately 58% to 68%.
* At 100000 training examples, accuracy ranges from approximately 62% to 70%.
* At 1000000 training examples, accuracy ranges from approximately 64% to 68%.
* **Trendline Approximation:**
* At 100 training examples, the trendline indicates an accuracy of approximately 53%.
* At 1000 training examples, the trendline indicates an accuracy of approximately 58%.
* At 10000 training examples, the trendline indicates an accuracy of approximately 62%.
* At 100000 training examples, the trendline indicates an accuracy of approximately 65%.
* At 1000000 training examples, the trendline indicates an accuracy of approximately 67%.
* **Maximum Accuracy:** The horizontal line at 91.4% represents an upper bound on the achievable accuracy, potentially indicating the performance of a more complex model or the theoretical limit of the dataset.
### Key Observations
* The accuracy increases rapidly with the initial increase in training examples (from 100 to 10000).
* The rate of accuracy increase slows down as the number of training examples continues to grow (from 100000 to 1000000). This suggests diminishing returns from adding more data.
* The accuracy appears to be approaching an asymptote, as it plateaus around 67% even with a million training examples.
* There is significant variance in the accuracy for a given number of training examples, as evidenced by the spread of the blue 'x' markers.
### Interpretation
This learning curve suggests that the model is data-limited. Increasing the number of training examples initially leads to significant improvements in accuracy, but eventually, the gains become marginal. The horizontal line at 91.4% suggests that the model may be underfitting, or that the dataset itself has inherent limitations preventing it from reaching higher accuracy levels. Further improvements might require more complex models, feature engineering, or a larger, more diverse dataset. The diminishing returns observed at higher training example counts indicate that simply adding more data may not be the most effective strategy for improving performance. The spread of data points suggests that the model's performance is sensitive to the specific training data used.