## Bar Chart: Accuracy by Metric and Approach
### Overview
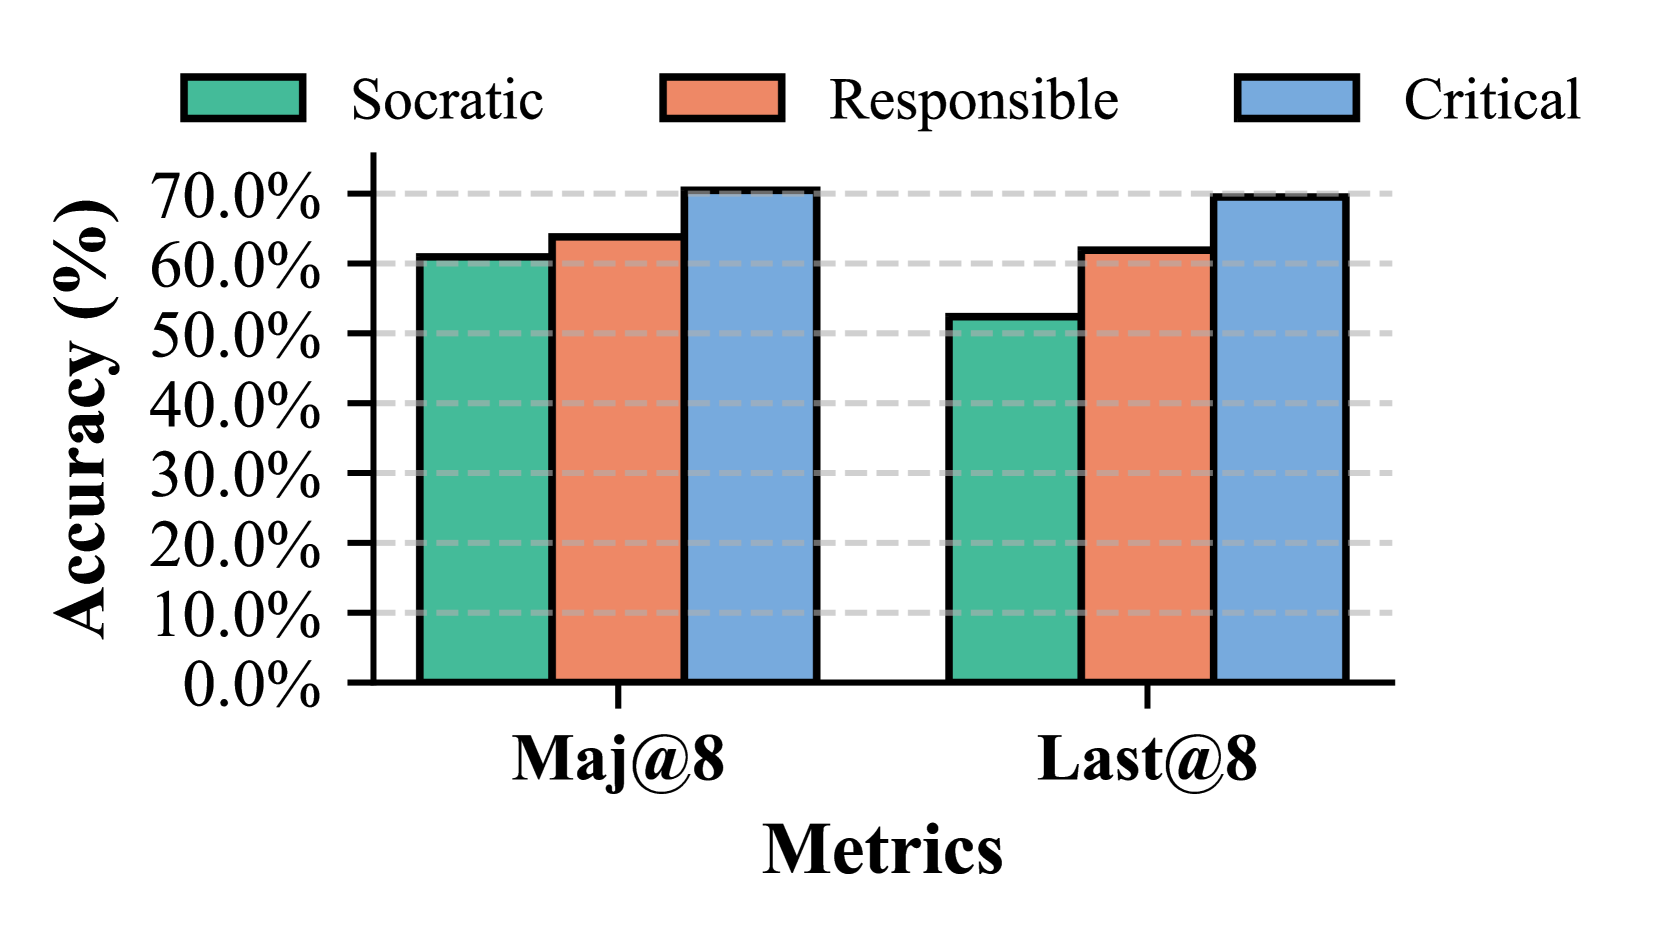
The image is a bar chart comparing the accuracy (in percentage) of three different approaches ("Socratic", "Responsible", and "Critical") across two metrics ("Maj@8" and "Last@8"). The chart uses color-coded bars to represent each approach, with a legend at the top for identification.
### Components/Axes
* **Title:** Implicit, but the chart compares accuracy across different metrics and approaches.
* **X-axis:** "Metrics" with two categories: "Maj@8" and "Last@8".
* **Y-axis:** "Accuracy (%)" ranging from 0.0% to 70.0% in increments of 10.0%.
* **Legend:** Located at the top of the chart.
* Green: "Socratic"
* Orange: "Responsible"
* Blue: "Critical"
* **Gridlines:** Horizontal dashed lines at each 10% increment on the y-axis.
### Detailed Analysis
Here's a breakdown of the accuracy for each approach and metric:
* **Maj@8 Metric:**
* Socratic (Green): Approximately 61.0% accuracy.
* Responsible (Orange): Approximately 64.0% accuracy.
* Critical (Blue): Approximately 70.0% accuracy.
* **Last@8 Metric:**
* Socratic (Green): Approximately 53.0% accuracy.
* Responsible (Orange): Approximately 62.0% accuracy.
* Critical (Blue): Approximately 69.0% accuracy.
### Key Observations
* For both metrics, the "Critical" approach consistently achieves the highest accuracy, followed by "Responsible" and then "Socratic".
* All three approaches show a decrease in accuracy when moving from the "Maj@8" metric to the "Last@8" metric.
* The "Socratic" approach experiences the largest drop in accuracy between the two metrics.
### Interpretation
The chart suggests that the "Critical" approach is the most effective among the three in terms of accuracy, regardless of the metric used. The decrease in accuracy from "Maj@8" to "Last@8" across all approaches indicates that the "Last@8" metric may be more challenging or require a different strategy. The significant drop in "Socratic" accuracy for "Last@8" suggests this approach is particularly sensitive to the change in metric.