## Bar Chart: Accuracy by Metrics and Strategy
### Overview
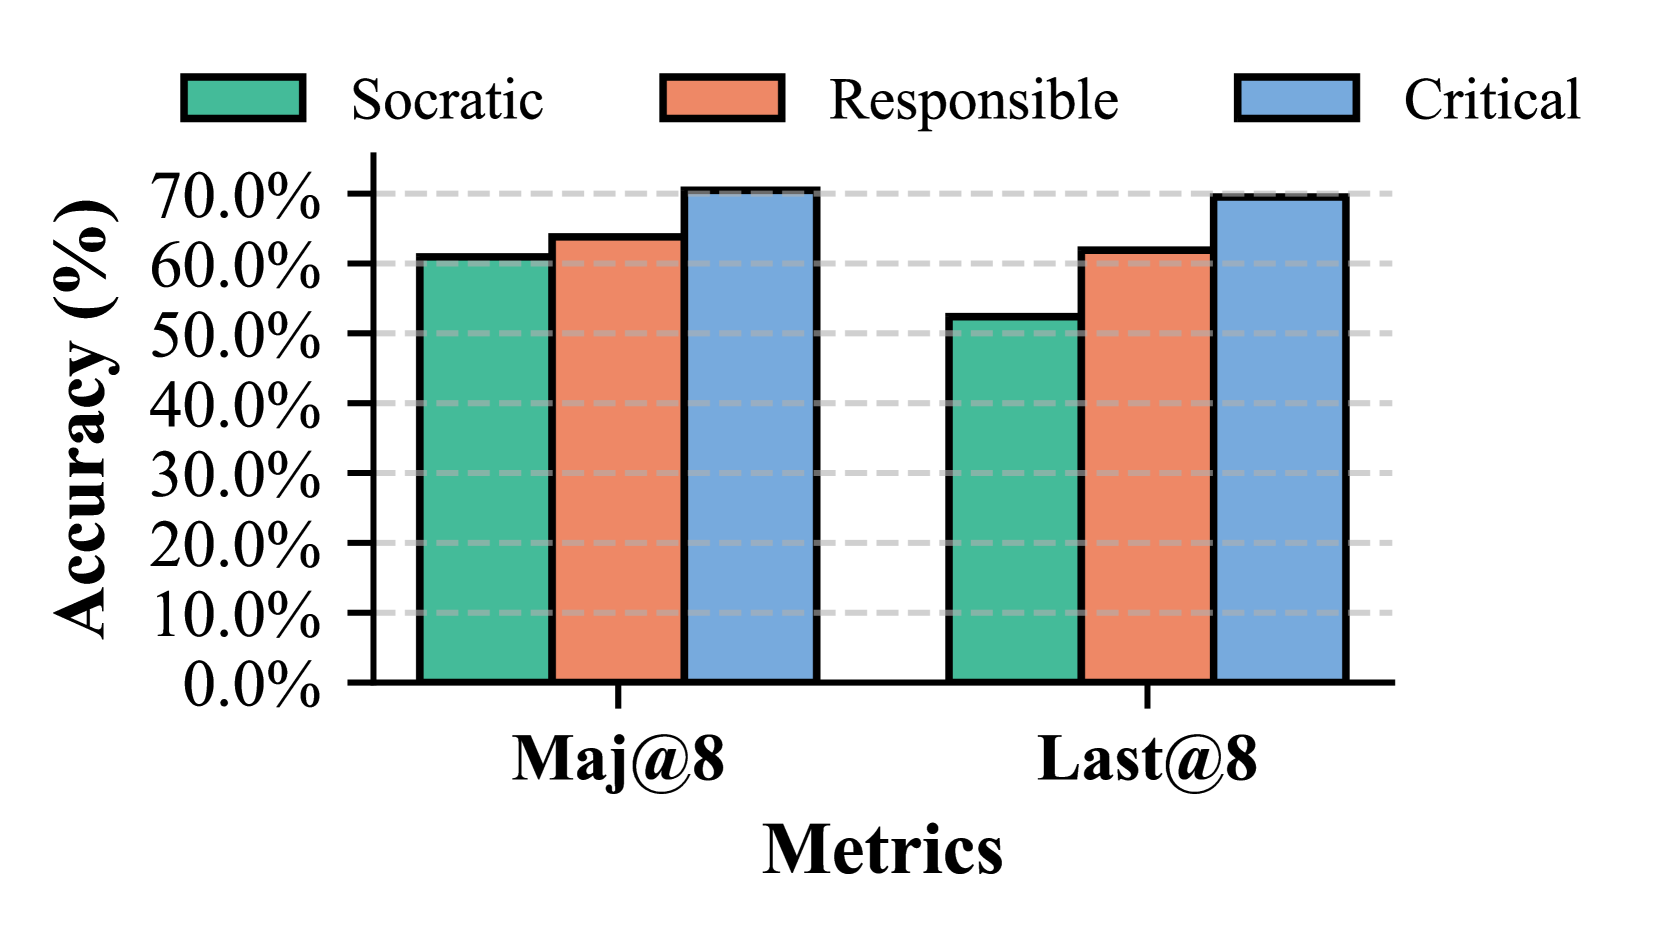
This image is a bar chart displaying the accuracy (%) for three different strategies (Socratic, Responsible, Critical) across two metrics (Maj@8 and Last@8). The chart uses vertical bars to represent the accuracy values for each combination.
### Components/Axes
* **Title:** The chart does not have an explicit overall title, but the content is described by the axis labels and legend.
* **Y-axis:**
* **Label:** "Accuracy (%)"
* **Scale:** Ranges from 0.0% to 70.0%, with major tick marks at 10.0% intervals (0.0%, 10.0%, 20.0%, 30.0%, 40.0%, 50.0%, 60.0%, 70.0%).
* **Tick Markers:** Horizontal dashed lines are present at each 10.0% increment.
* **X-axis:**
* **Label:** "Metrics"
* **Categories:** Two main categories are displayed: "Maj@8" and "Last@8".
* **Legend:** Located at the top of the chart, it associates colors with strategies:
* Teal square: "Socratic"
* Coral square: "Responsible"
* Light blue square: "Critical"
### Detailed Analysis
The chart presents data for two metrics, "Maj@8" and "Last@8". For each metric, there are three bars representing the accuracy of the "Socratic", "Responsible", and "Critical" strategies.
**Metric: Maj@8**
* **Socratic (Teal bar):** The bar reaches approximately 61.0% accuracy.
* **Responsible (Coral bar):** The bar reaches approximately 64.0% accuracy.
* **Critical (Light blue bar):** The bar reaches approximately 71.0% accuracy.
**Metric: Last@8**
* **Socratic (Teal bar):** The bar reaches approximately 52.0% accuracy.
* **Responsible (Coral bar):** The bar reaches approximately 62.0% accuracy.
* **Critical (Light blue bar):** The bar reaches approximately 70.0% accuracy.
### Key Observations
* **"Critical" strategy consistently shows the highest accuracy** across both metrics.
* **"Socratic" strategy shows the lowest accuracy** across both metrics.
* There is a **general decrease in accuracy for the "Socratic" strategy** from "Maj@8" to "Last@8" (from ~61% to ~52%).
* The **"Responsible" and "Critical" strategies maintain relatively high accuracy** from "Maj@8" to "Last@8", with a slight decrease for "Critical" (~71% to ~70%) and a slight decrease for "Responsible" (~64% to ~62%).
### Interpretation
This bar chart demonstrates the comparative performance of three different strategies ("Socratic", "Responsible", "Critical") based on accuracy for two distinct metrics ("Maj@8" and "Last@8").
The data suggests that the "Critical" strategy is the most effective in terms of accuracy, consistently outperforming the other two strategies. Conversely, the "Socratic" strategy appears to be the least effective. The "Responsible" strategy falls in between.
The trend observed for the "Socratic" strategy, showing a notable drop in accuracy from "Maj@8" to "Last@8", might indicate that this strategy is less robust or adaptable to changes represented by the "Last@8" metric. The relative stability of the "Responsible" and "Critical" strategies suggests they are more consistent performers.
The "Maj@8" metric seems to yield higher accuracies overall for the "Responsible" and "Critical" strategies compared to "Last@8", although the difference is more pronounced for "Socratic". This could imply that the "Maj@8" metric is a more favorable or easier condition for achieving high accuracy with these strategies, or that "Last@8" introduces a more challenging aspect.
In essence, the chart provides a clear visual comparison of strategy effectiveness, highlighting "Critical" as the top performer and "Socratic" as the lowest, with "Responsible" in the middle, across the evaluated metrics.