## Bar Chart: Accuracy Comparison Across Metrics and Categories
### Overview
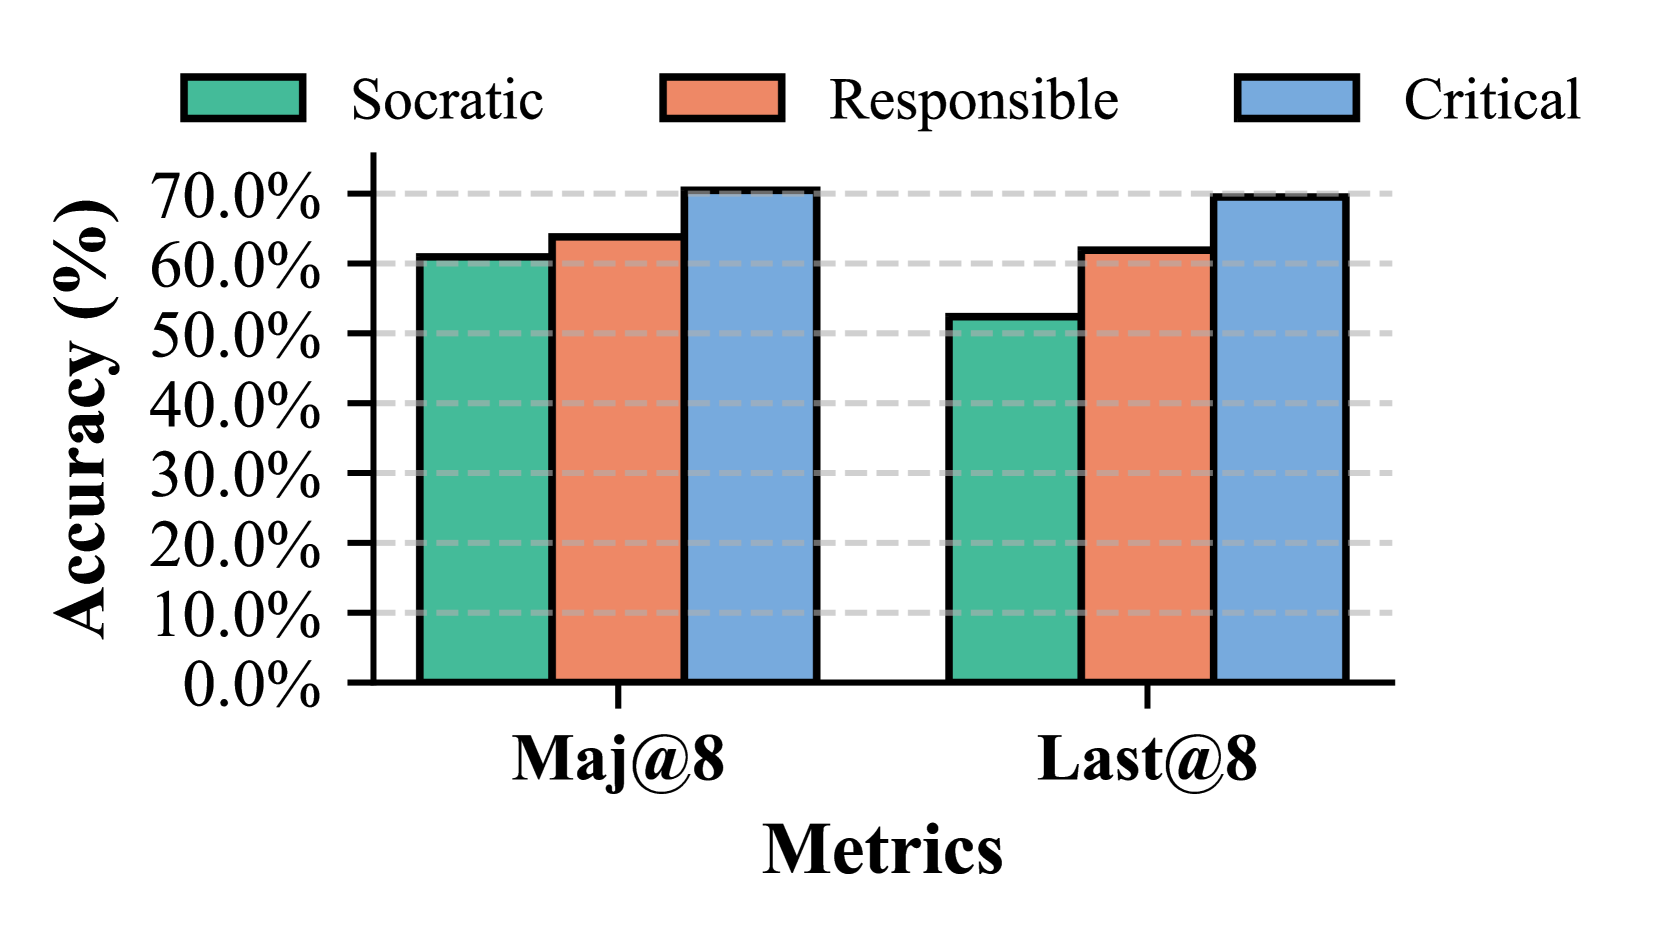
The chart compares accuracy percentages (%) across two metrics ("Maj@8" and "Last@8") for three categories: "Socratic" (green), "Responsible" (orange), and "Critical" (blue). Accuracy values are represented as vertical bars, with the y-axis ranging from 0% to 70% in 10% increments.
### Components/Axes
- **X-axis (Metrics)**:
- Labels: "Maj@8" (left) and "Last@8" (right)
- **Y-axis (Accuracy)**:
- Scale: 0% to 70% (dashed horizontal lines at 10% intervals)
- Label: "Accuracy (%)"
- **Legend**:
- Position: Top-right
- Categories:
- Socratic (green)
- Responsible (orange)
- Critical (blue)
### Detailed Analysis
- **Maj@8**:
- Socratic: ~60% (green bar)
- Responsible: ~65% (orange bar)
- Critical: ~70% (blue bar)
- **Last@8**:
- Socratic: ~50% (green bar)
- Responsible: ~60% (orange bar)
- Critical: ~70% (blue bar)
### Key Observations
1. **Critical Category Dominance**:
- Critical consistently achieves the highest accuracy (~70%) in both metrics, with no significant drop between "Maj@8" and "Last@8".
2. **Socratic Decline**:
- Socratic accuracy drops from ~60% ("Maj@8") to ~50% ("Last@8"), a 10% decrease.
3. **Responsible Stability**:
- Responsible maintains ~60-65% accuracy across both metrics.
4. **Color Consistency**:
- All bars match their legend colors (green = Socratic, orange = Responsible, blue = Critical).
### Interpretation
The data suggests that the "Critical" category is prioritized or optimized for accuracy, maintaining near-peak performance across both metrics. The "Socratic" category shows a notable decline in "Last@8", potentially indicating a shift in strategy or resource allocation. The "Responsible" category acts as a middle ground, with stable but suboptimal performance compared to "Critical". These trends could reflect differing algorithmic priorities or risk thresholds in the evaluated system.