## Scatter Plot: Virology Confidence vs. Target Length
### Overview
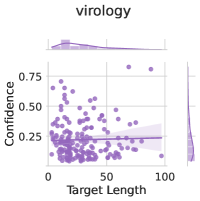
The image is a scatter plot showing the relationship between "Confidence" and "Target Length" in the context of "virology". The plot includes marginal distributions (histograms) along the x and y axes. A regression line with a confidence interval is also plotted.
### Components/Axes
* **Title:** virology
* **X-axis:** Target Length
* Scale: 0 to 100, with increments of 50.
* **Y-axis:** Confidence
* Scale: 0 to 0.75, with increments of 0.25.
* **Data Points:** Each point represents a data entry, with its position determined by its "Target Length" and "Confidence" values. The points are colored in a light purple.
* **Marginal Distributions:** Histograms are present along both axes, showing the distribution of "Target Length" and "Confidence" values.
* **Regression Line:** A light purple regression line is plotted with a shaded confidence interval.
### Detailed Analysis
* **Target Length Distribution:** The histogram along the x-axis shows a concentration of data points towards lower "Target Length" values.
* **Confidence Distribution:** The histogram along the y-axis shows a concentration of data points towards lower "Confidence" values.
* **Scatter Plot:** The scatter plot shows a cluster of points at lower "Target Length" and "Confidence" values. As "Target Length" increases, the "Confidence" values appear to spread out, with no clear trend.
* **Regression Line:** The regression line is nearly flat, indicating a very weak or non-existent correlation between "Target Length" and "Confidence".
### Key Observations
* Most data points are clustered at low "Target Length" and low "Confidence" values.
* There is no strong correlation between "Target Length" and "Confidence".
### Interpretation
The scatter plot suggests that in the context of "virology", there is no strong relationship between the "Target Length" and the "Confidence" score. The clustering of data points at low values for both variables might indicate a bias in the data or a characteristic of the virology data being analyzed. The nearly flat regression line reinforces the lack of correlation.