## Scatter Plot with Marginal Distributions: Virology Confidence vs. Target Length
### Overview
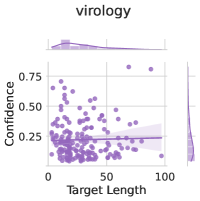
The image is a statistical chart, specifically a scatter plot with marginal distribution plots (density plots) on the top and right edges. It visualizes the relationship between "Target Length" and "Confidence" within a virology context. The overall aesthetic is minimalist, using a single purple color scheme against a white background with light gray grid lines.
### Components/Axes
* **Title:** "virology" (centered at the top).
* **Main Plot Area:**
* **X-Axis:** Labeled "Target Length". The scale runs from 0 to 100, with major tick marks at 0, 50, and 100.
* **Y-Axis:** Labeled "Confidence". The scale runs from 0.00 to 1.00, with major tick marks at 0.00, 0.25, 0.50, 0.75, and 1.00.
* **Data Series:** Represented by purple circles (scatter points). There is no explicit legend, as only one data series is present.
* **Trend Line:** A solid purple line runs through the data, showing a fitted model (likely a regression line). It is accompanied by a semi-transparent purple shaded area, representing the confidence interval or standard error band around the trend.
* **Marginal Plots:**
* **Top Marginal Plot:** A density plot (smoothed histogram) aligned with the X-axis ("Target Length"). It shows the distribution of data points along the target length dimension.
* **Right Marginal Plot:** A density plot aligned with the Y-axis ("Confidence"). It shows the distribution of data points along the confidence dimension.
### Detailed Analysis
* **Data Point Distribution:** The scatter points are densely clustered in the lower-left quadrant of the plot. The highest concentration appears where "Target Length" is between approximately 0 and 40, and "Confidence" is between 0.10 and 0.40.
* **Trend Line Analysis:** The solid purple trend line exhibits a very slight downward slope from left to right. It starts at a confidence value of approximately 0.30 when Target Length is 0 and decreases to approximately 0.25 when Target Length is 100. The shaded confidence band around this line is relatively narrow, suggesting some certainty in this weak negative trend.
* **Marginal Distributions:**
* **Target Length (Top):** The distribution is right-skewed. The peak density is at the lower end (near 0), with a long tail extending towards 100. This indicates most data points have short target lengths.
* **Confidence (Right):** The distribution is also right-skewed, with the highest density around a confidence value of 0.20-0.30. The density drops off sharply above 0.50, with very few points above 0.75.
### Key Observations
1. **Inverse Relationship:** There is a weak negative correlation between Target Length and Confidence. As the target length increases, the confidence score shows a slight tendency to decrease.
2. **Data Sparsity:** The data is highly uneven. The vast majority of observations are concentrated at low target lengths and low-to-moderate confidence scores. The upper-right quadrant (high length, high confidence) is virtually empty.
3. **Outliers:** A few scattered points exist with confidence scores above 0.50, primarily at lower target lengths (below ~50). One notable outlier appears near (Target Length ≈ 80, Confidence ≈ 0.80).
4. **Uncertainty:** The model's confidence (as shown by the shaded band) is fairly consistent across the range of target lengths, though it appears slightly wider at the extreme right (lengths near 100), where data is sparse.
### Interpretation
This chart suggests that in the context of this virology dataset, longer genetic or protein targets are associated with slightly lower confidence in the model's predictions or measurements. The strong clustering at low lengths and low confidence could indicate several possibilities:
* The model or assay performs best on shorter, perhaps more conserved or well-understood, target regions.
* The dataset itself is imbalanced, containing many more examples of short targets, which are typically easier to analyze with high confidence.
* The "Confidence" metric might be inherently lower for longer targets due to increased complexity, potential for errors, or higher variability in the underlying biological data.
The marginal distributions confirm the imbalance in the dataset. The investigation should focus on why confidence drops with length: is it a fundamental limitation of the method, an artifact of the data collection, or a true biological signal? The outlier with high confidence at a long target length is particularly interesting and warrants individual examination to understand what makes that case successful.