## Heatmaps: Comparison of Two Datasets
### Overview
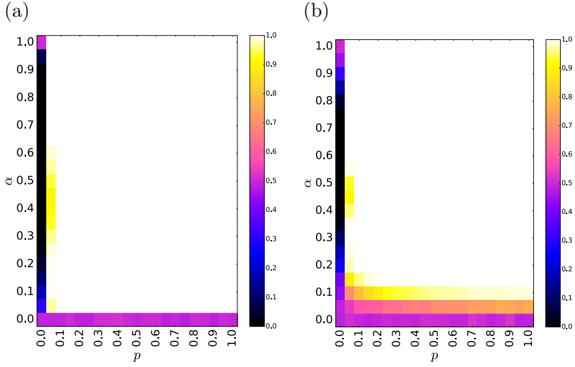
The image presents two heatmaps, labeled (a) and (b), displaying the relationship between two variables, 'p' on the x-axis and 'α' on the y-axis. The color intensity represents a third, unnamed variable, ranging from 0 (black/purple) to 1 (yellow). Both heatmaps share the same axes and color scale, allowing for a direct comparison of the data distributions.
### Components/Axes
* **Titles:** (a) and (b) are located at the top-left of each heatmap.
* **X-axis:** Labeled 'p', with values ranging from 0.0 to 1.0 in increments of 0.1.
* **Y-axis:** Labeled 'α', with values ranging from 0.0 to 1.0 in increments of 0.1.
* **Color Scale:** A vertical color bar is present to the right of each heatmap. The scale ranges from 0.0 (black/purple) at the bottom to 1.0 (yellow) at the top, with intermediate values represented by shades of purple, pink, orange, and yellow. The color scale is linear.
### Detailed Analysis
**Heatmap (a):**
* A strong vertical band of high values (yellow) is present along the y-axis (p = 0.0) from α = 0.3 to α = 0.6.
* The region where α = 1.0 and p = 0.0 is black, indicating a value of 0.
* The rest of the heatmap is mostly purple, indicating low values close to 0.
**Heatmap (b):**
* Similar to (a), a vertical band of high values (yellow) is present along the y-axis (p = 0.0) from α = 0.4 to α = 0.5.
* There is a horizontal band of slightly elevated values (pink/purple) along the x-axis (α = 0.0) from p = 0.1 to p = 1.0.
* The region where α = 1.0 and p = 0.0 is black, indicating a value of 0.
* The rest of the heatmap is mostly purple, indicating low values close to 0.
### Key Observations
* Both heatmaps show a concentration of high values when p is close to 0.0.
* Heatmap (b) shows a slightly higher baseline value across the range of 'p' when 'α' is 0.0, compared to heatmap (a).
* The high-value band is narrower in heatmap (b) compared to heatmap (a).
### Interpretation
The heatmaps visualize the relationship between parameters 'p' and 'α' and their impact on a third, unnamed variable. The concentration of high values at low 'p' suggests that this parameter has a significant influence on the outcome. The differences between heatmaps (a) and (b) indicate that the relationship between 'p', 'α', and the unnamed variable differs between the two datasets. The horizontal band in heatmap (b) suggests that when 'α' is 0.0, the value of the unnamed variable is slightly elevated regardless of the value of 'p'. The data suggests that the underlying process is sensitive to the value of 'p' when it is near zero, and that the effect of 'α' is more nuanced and potentially dependent on the specific dataset.