\n
## Heatmaps: Parameter Space Analysis
### Overview
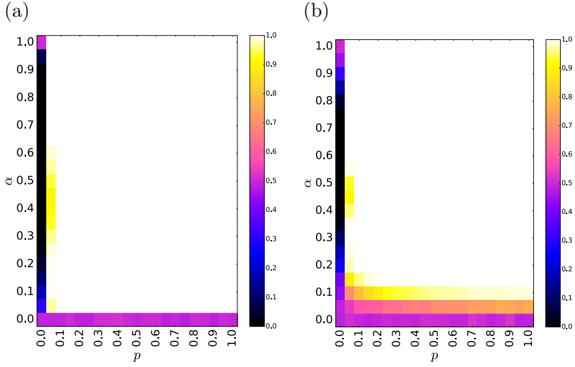
The image presents two heatmaps, labeled (a) and (b), visualizing a two-dimensional parameter space defined by 'p' and 'q'. The color intensity represents a value associated with each (p, q) pair. Both heatmaps share the same axes scales, but display different distributions of color intensity.
### Components/Axes
Both heatmaps share the following components:
* **X-axis:** Labeled 'p', ranging from 0.0 to 1.0 with increments of approximately 0.1.
* **Y-axis:** Labeled 'q', ranging from 0.0 to 1.0 with increments of approximately 0.1.
* **Colorbar:** A vertical colorbar on the right side of each heatmap, ranging from approximately 0.0 (dark purple) to 1.0 (yellow). The colorbar indicates the value corresponding to each color.
### Detailed Analysis or Content Details
**Heatmap (a):**
* The heatmap shows a strong vertical gradient.
* The left side of the heatmap (low 'p' values) is predominantly purple, indicating values close to 0.0.
* As 'p' increases, the color transitions through shades of magenta, pink, yellow, and finally to a bright yellow at p=1.0 for q values between 0.3 and 0.7.
* For p values close to 1.0, the color is predominantly yellow, indicating values close to 1.0.
* The top-right corner (p=1.0, q=1.0) is yellow.
* The bottom-left corner (p=0.0, q=0.0) is dark purple.
**Heatmap (b):**
* The heatmap shows a more complex distribution of color intensity.
* The top-left corner (p=0.0, q=1.0) is dark purple, indicating values close to 0.0.
* There is a yellow region around (p=0.1, q=0.2), indicating a value close to 1.0.
* A diagonal band of yellow extends from approximately (p=0.2, q=0.2) to (p=0.6, q=0.6), indicating values close to 1.0.
* The bottom-right corner (p=1.0, q=0.0) is yellow, indicating values close to 1.0.
* The top-right corner (p=1.0, q=1.0) is dark purple, indicating values close to 0.0.
### Key Observations
* Heatmap (a) exhibits a clear dependence on the 'p' parameter, with 'q' having a minimal effect.
* Heatmap (b) shows a more complex relationship between 'p' and 'q', with regions of high and low values distributed across the parameter space.
* The color scales are identical, allowing for direct comparison of the values represented in each heatmap.
* The presence of distinct color regions in both heatmaps suggests that the underlying function is not smooth or continuous.
### Interpretation
The heatmaps likely represent the results of a simulation or calculation where 'p' and 'q' are input parameters. The color intensity indicates the value of some output variable or metric.
* **Heatmap (a)** suggests that the output is primarily determined by 'p', with 'q' having little influence. The output increases monotonically with 'p', reaching a maximum value of approximately 1.0 when 'p' is close to 1.0. This could represent a threshold effect, where the output only becomes significant when 'p' exceeds a certain value.
* **Heatmap (b)** indicates a more complex relationship between 'p' and 'q'. The presence of a diagonal band of high values suggests that the output is maximized when 'p' and 'q' are approximately equal. The isolated yellow region at (p=0.1, q=0.2) could represent a specific condition or scenario where the output is particularly high. The dark purple top-right corner suggests that the output is suppressed when both 'p' and 'q' are close to 1.0.
The difference between the two heatmaps suggests that the underlying model or system has been modified or that different parameters have been used in the two calculations. Further investigation would be needed to determine the specific meaning of 'p' and 'q' and the nature of the output variable.