## Heatmaps: α vs p with Color Intensity Scales
### Overview
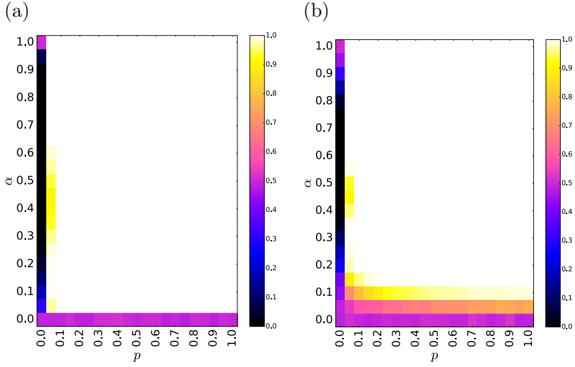
Two side-by-side heatmaps (a) and (b) visualize the relationship between variables α (y-axis) and p (x-axis) using color intensity gradients. Both share identical axis ranges (0.0–1.0) but differ in color distribution patterns. Color scales on the right quantify intensity from 0.0 (dark purple) to 1.0 (bright yellow).
---
### Components/Axes
- **X-axis (p)**: Labeled "p" for both heatmaps, ranging from 0.0 to 1.0 in 0.1 increments.
- **Y-axis (α)**: Labeled "α" for both heatmaps, ranging from 0.0 to 1.0 in 0.1 increments.
- **Color Scale**: Right-aligned legend with gradient from purple (0.0) to yellow (1.0), labeled with values 0.0–1.0 in 0.1 increments.
- **Legend Position**: Right side of both heatmaps, occupying ~20% of total width.
---
### Detailed Analysis
#### Heatmap (a)
- **Color Distribution**:
- Dominated by dark purple (0.0–0.1 intensity) across most of the plot.
- A vertical yellow stripe (~0.8–1.0 intensity) appears at α ≈ 0.5, spanning all p values.
- Minimal intermediate colors (orange/red) observed near α ≈ 0.3–0.4.
- **Key Data Points**:
- α = 0.5: Consistent high intensity (yellow) across p = 0.0–1.0.
- α = 0.0–0.1: Uniform low intensity (purple) regardless of p.
#### Heatmap (b)
- **Color Distribution**:
- Dominated by dark purple (0.0–0.1 intensity) across most of the plot.
- A horizontal yellow stripe (~0.8–1.0 intensity) appears at p ≈ 0.5, spanning all α values.
- Minimal intermediate colors (orange/red) observed near p ≈ 0.3–0.4.
- **Key Data Points**:
- p = 0.5: Consistent high intensity (yellow) across α = 0.0–1.0.
- p = 0.0–0.1: Uniform low intensity (purple) regardless of α.
---
### Key Observations
1. **Symmetry in Critical Regions**:
- Heatmap (a) highlights α = 0.5 as a universal high-intensity region, independent of p.
- Heatmap (b) highlights p = 0.5 as a universal high-intensity region, independent of α.
2. **Uniform Extremes**:
- Both heatmaps show uniform low intensity (purple) at the edges (α/p ≈ 0.0–0.1).
3. **Color Consistency**:
- Yellow regions in both heatmaps align precisely with the 0.8–1.0 color scale, confirming intensity thresholds.
---
### Interpretation
The heatmaps suggest a **threshold effect** at midpoints (α = 0.5 in a, p = 0.5 in b), where values abruptly transition to maximum intensity. This implies:
- **Critical Parameter Interaction**: α and p may interact nonlinearly, with mid-range values (0.5) acting as pivotal points for system behavior.
- **Edge Stability**: Extremely low values (α/p ≈ 0.0–0.1) exhibit uniform stability (low intensity), while mid-range values drive variability.
- **Potential Symmetry**: The mirrored critical regions in (a) and (b) hint at a symmetric relationship between α and p in the underlying model.
No textual annotations or additional legends are present. The absence of intermediate color gradients (e.g., orange/red) in most regions suggests binary-like behavior, with values either near 0.0 or 1.0.