# Technical Document Extraction: Spectral Amplitude Analysis
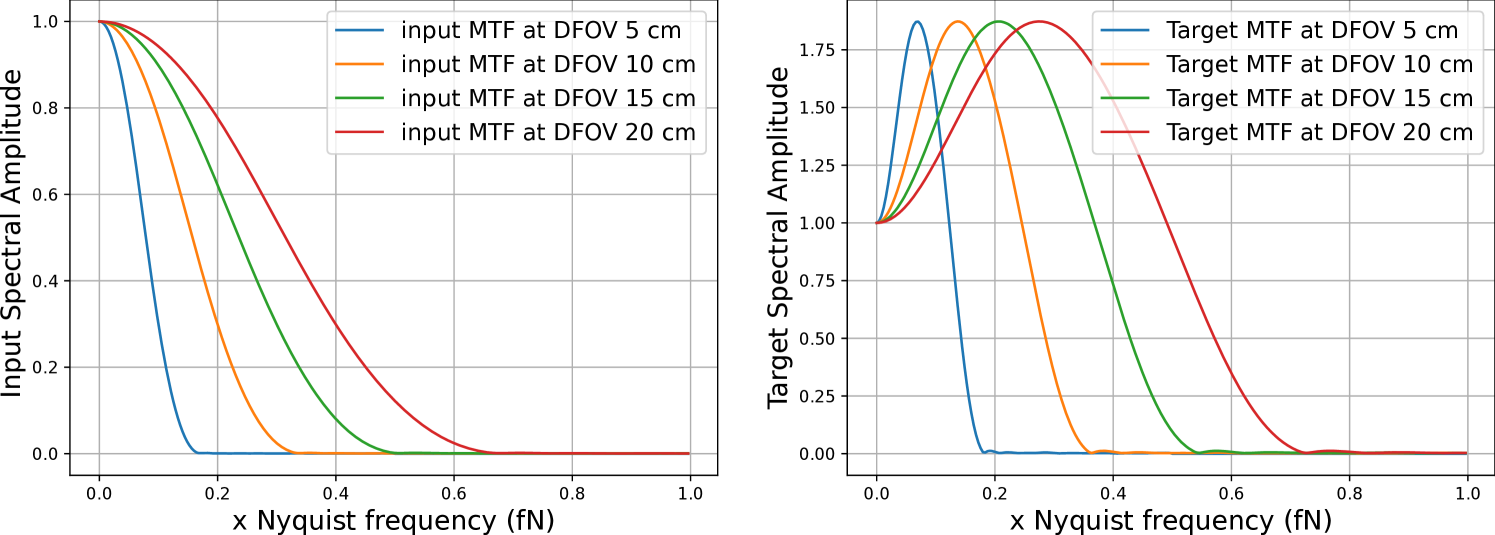
## Chart 1: Input Spectral Amplitude
### Axes and Labels
- **X-axis**: `x Nyquist frequency (fN)`
- Markers: `0.0`, `0.2`, `0.4`, `0.6`, `0.8`, `1.0`
- **Y-axis**: `Input Spectral Amplitude`
- Range: `0.0` to `1.0` in increments of `0.2`
### Legend
- **Placement**: Right side of the chart
- **Labels and Colors**:
- `input MTF at DFOV 5 cm` (blue)
- `input MTF at DFOV 10 cm` (orange)
- `input MTF at DFOV 15 cm` (green)
- `input MTF at DFOV 20 cm` (red)
### Data Trends and Points
1. **Blue Line (5 cm DFOV)**:
- **Trend**: Steepest decline from `1.0` at `0.0 fN` to near `0.0` by `0.2 fN`.
- **Key Points**:
- `[0.0, 1.0]`
- `[0.2, ~0.0]`
2. **Orange Line (10 cm DFOV)**:
- **Trend**: Rapid decline, slower than blue.
- **Key Points**:
- `[0.0, 1.0]`
- `[0.4, ~0.0]`
3. **Green Line (15 cm DFOV)**:
- **Trend**: Gradual decline, flattest among input lines.
- **Key Points**:
- `[0.0, 1.0]`
- `[0.8, ~0.0]`
4. **Red Line (20 cm DFOV)**:
- **Trend**: Slowest decline, nearly flat after `0.6 fN`.
- **Key Points**:
- `[0.0, 1.0]`
- `[1.0, ~0.0]`
---
## Chart 2: Target Spectral Amplitude
### Axes and Labels
- **X-axis**: `x Nyquist frequency (fN)`
- Markers: `0.0`, `0.2`, `0.4`, `0.6`, `0.8`, `1.0`
- **Y-axis**: `Target Spectral Amplitude`
- Range: `0.0` to `1.75` in increments of `0.25`
### Legend
- **Placement**: Right side of the chart
- **Labels and Colors**:
- `Target MTF at DFOV 5 cm` (blue)
- `Target MTF at DFOV 10 cm` (orange)
- `Target MTF at DFOV 15 cm` (green)
- `Target MTF at DFOV 20 cm` (red)
### Data Trends and Points
1. **Blue Line (5 cm DFOV)**:
- **Trend**: Sharp peak at `0.1 fN`, then rapid decline.
- **Key Points**:
- `[0.0, 1.0]`
- `[0.1, ~1.75]`
- `[0.2, ~0.0]`
2. **Orange Line (10 cm DFOV)**:
- **Trend**: Broad peak centered at `0.15 fN`, higher amplitude than blue.
- **Key Points**:
- `[0.0, 1.0]`
- `[0.15, ~1.75]`
- `[0.3, ~0.0]`
3. **Green Line (15 cm DFOV)**:
- **Trend**: Lower peak at `0.2 fN`, slower decline.
- **Key Points**:
- `[0.0, 1.0]`
- `[0.2, ~1.5]`
- `[0.4, ~0.0]`
4. **Red Line (20 cm DFOV)**:
- **Trend**: Broadest peak at `0.25 fN`, lowest amplitude.
- **Key Points**:
- `[0.0, 1.0]`
- `[0.25, ~1.25]`
- `[0.5, ~0.0]`
---
## Cross-Reference Validation
- **Legend Consistency**:
- All colors in both charts match their respective DFOV labels (e.g., blue = 5 cm in both input and target charts).
- **Spatial Grounding**:
- Legends are positioned identically in both charts (right-aligned).
- **Trend Verification**:
- Input lines (Chart 1) show monotonic decay; target lines (Chart 2) exhibit resonant peaks inversely proportional to DFOV.
## Conclusion
The charts illustrate the relationship between Nyquist frequency and spectral amplitude for input and target MTF at varying DFOV distances. Input MTF amplitudes decay with increasing DFOV, while target MTF amplitudes exhibit resonant peaks that broaden and reduce in height with greater DFOV.