## Scatter Plot: Spatial Distribution of Points
### Overview
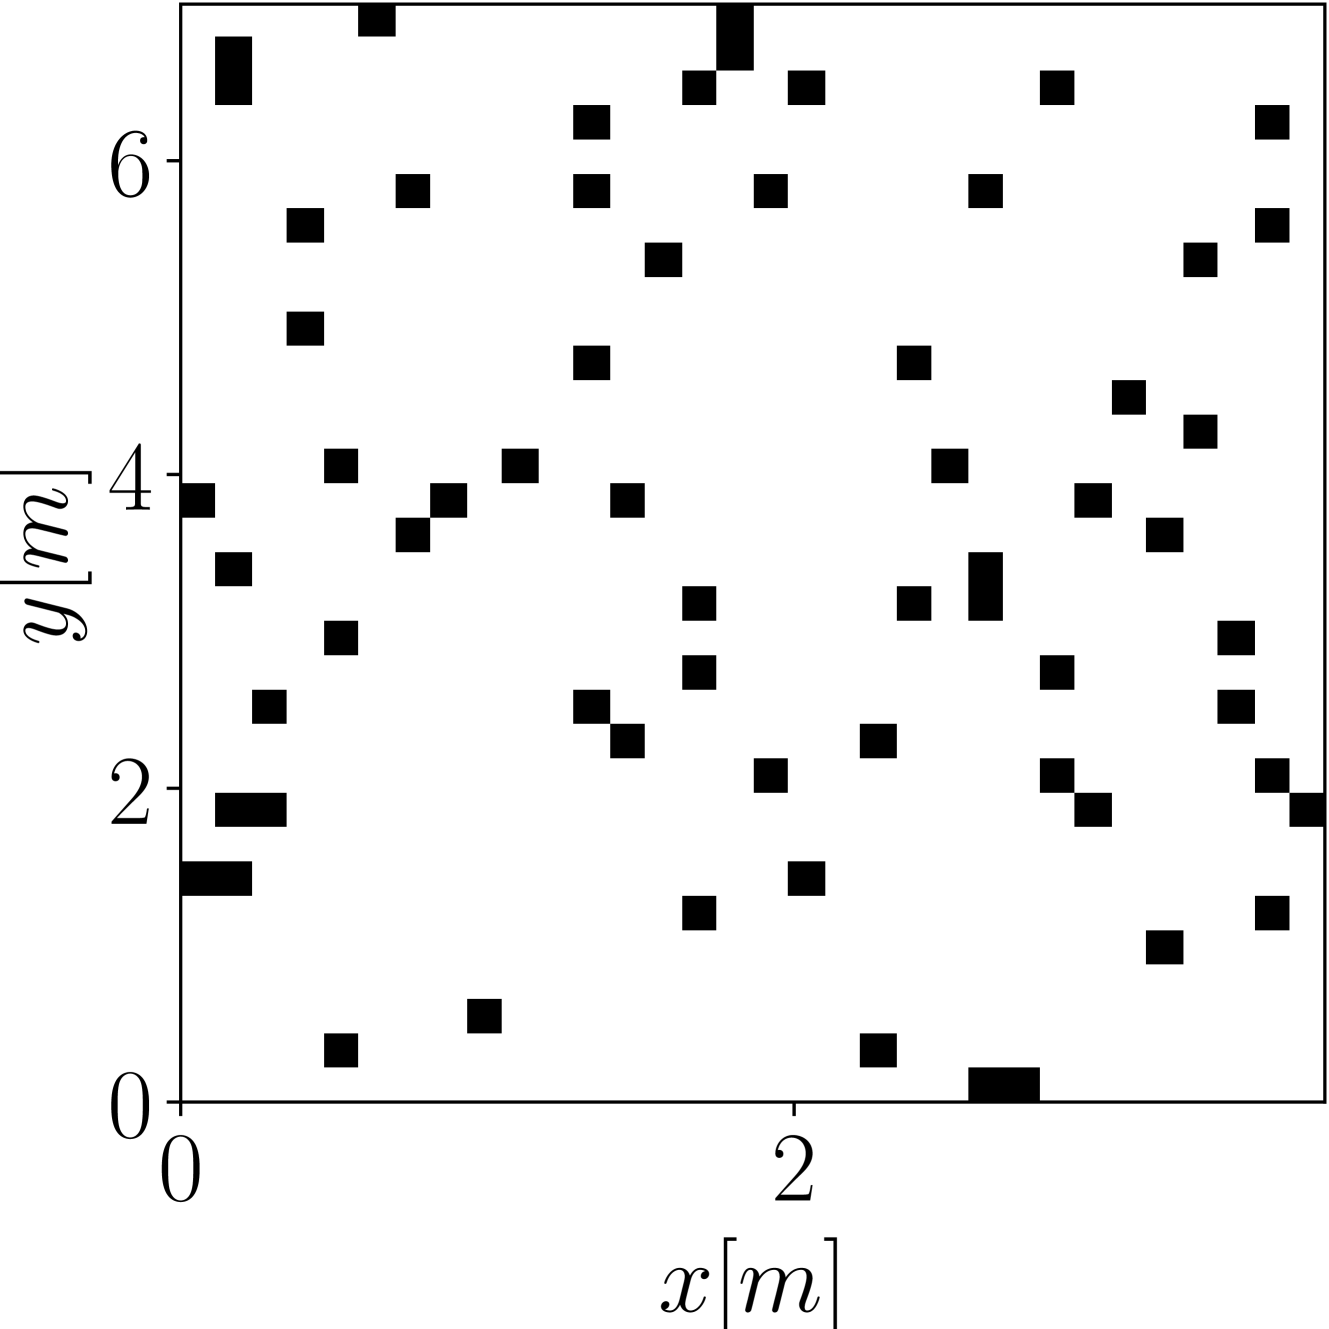
The image is a scatter plot showing the spatial distribution of black square points within a rectangular area. The x-axis represents the horizontal dimension in meters, ranging from 0 to 4. The y-axis represents the vertical dimension in meters, ranging from 0 to 7. The plot visualizes the locations of these points in a 2D space.
### Components/Axes
* **X-axis:**
* Label: *x [m]*
* Scale: 0 to 4, with major ticks at 0 and 2.
* **Y-axis:**
* Label: *y [m]*
* Scale: 0 to 7, with major ticks at 0, 2, 4, and 6.
* **Data Points:** Black squares scattered across the plot area.
### Detailed Analysis
The data points are black squares distributed across the plot. The x-coordinates of the points range from approximately 0 to 4 meters, and the y-coordinates range from approximately 0 to 7 meters. The distribution appears somewhat random, with no immediately obvious clustering or patterns.
Here's a breakdown of approximate locations of some of the points:
* Point 1: x ≈ 0.2, y ≈ 0.4
* Point 2: x ≈ 0.1, y ≈ 1.8
* Point 3: x ≈ 0.1, y ≈ 3.2
* Point 4: x ≈ 0.1, y ≈ 4.1
* Point 5: x ≈ 0.1, y ≈ 6.5
* Point 6: x ≈ 0.8, y ≈ 0.3
* Point 7: x ≈ 0.8, y ≈ 1.3
* Point 8: x ≈ 0.8, y ≈ 2.5
* Point 9: x ≈ 0.8, y ≈ 3.7
* Point 10: x ≈ 0.8, y ≈ 5.3
* Point 11: x ≈ 0.8, y ≈ 6.8
* Point 12: x ≈ 1.5, y ≈ 0.7
* Point 13: x ≈ 1.5, y ≈ 1.5
* Point 14: x ≈ 1.5, y ≈ 2.8
* Point 15: x ≈ 1.5, y ≈ 3.4
* Point 16: x ≈ 1.5, y ≈ 5.0
* Point 17: x ≈ 1.5, y ≈ 6.2
* Point 18: x ≈ 2.2, y ≈ 0.2
* Point 19: x ≈ 2.2, y ≈ 1.2
* Point 20: x ≈ 2.2, y ≈ 2.2
* Point 21: x ≈ 2.2, y ≈ 3.1
* Point 22: x ≈ 2.2, y ≈ 3.6
* Point 23: x ≈ 2.2, y ≈ 5.6
* Point 24: x ≈ 2.2, y ≈ 6.6
* Point 25: x ≈ 2.9, y ≈ 0.5
* Point 26: x ≈ 2.9, y ≈ 1.7
* Point 27: x ≈ 2.9, y ≈ 2.4
* Point 28: x ≈ 2.9, y ≈ 3.0
* Point 29: x ≈ 2.9, y ≈ 4.3
* Point 30: x ≈ 2.9, y ≈ 5.8
* Point 31: x ≈ 3.6, y ≈ 1.0
* Point 32: x ≈ 3.6, y ≈ 2.0
* Point 33: x ≈ 3.6, y ≈ 3.8
* Point 34: x ≈ 3.6, y ≈ 4.5
* Point 35: x ≈ 3.6, y ≈ 5.4
* Point 36: x ≈ 3.6, y ≈ 6.4
### Key Observations
* The points are distributed across the entire area of the plot.
* There are no obvious clusters or patterns in the distribution.
* The density of points appears relatively uniform across the plot.
### Interpretation
The scatter plot visualizes the spatial distribution of a set of points. The data suggests a random or near-random distribution of these points within the defined area. Without additional information, it's difficult to infer the meaning or significance of this distribution. The plot could represent the locations of objects, events, or any other spatial data. The lack of clustering suggests that the underlying process generating these points is either random or governed by factors not immediately apparent from the plot itself.