## Scatter Plot: Spatial Distribution of Data Points
### Overview
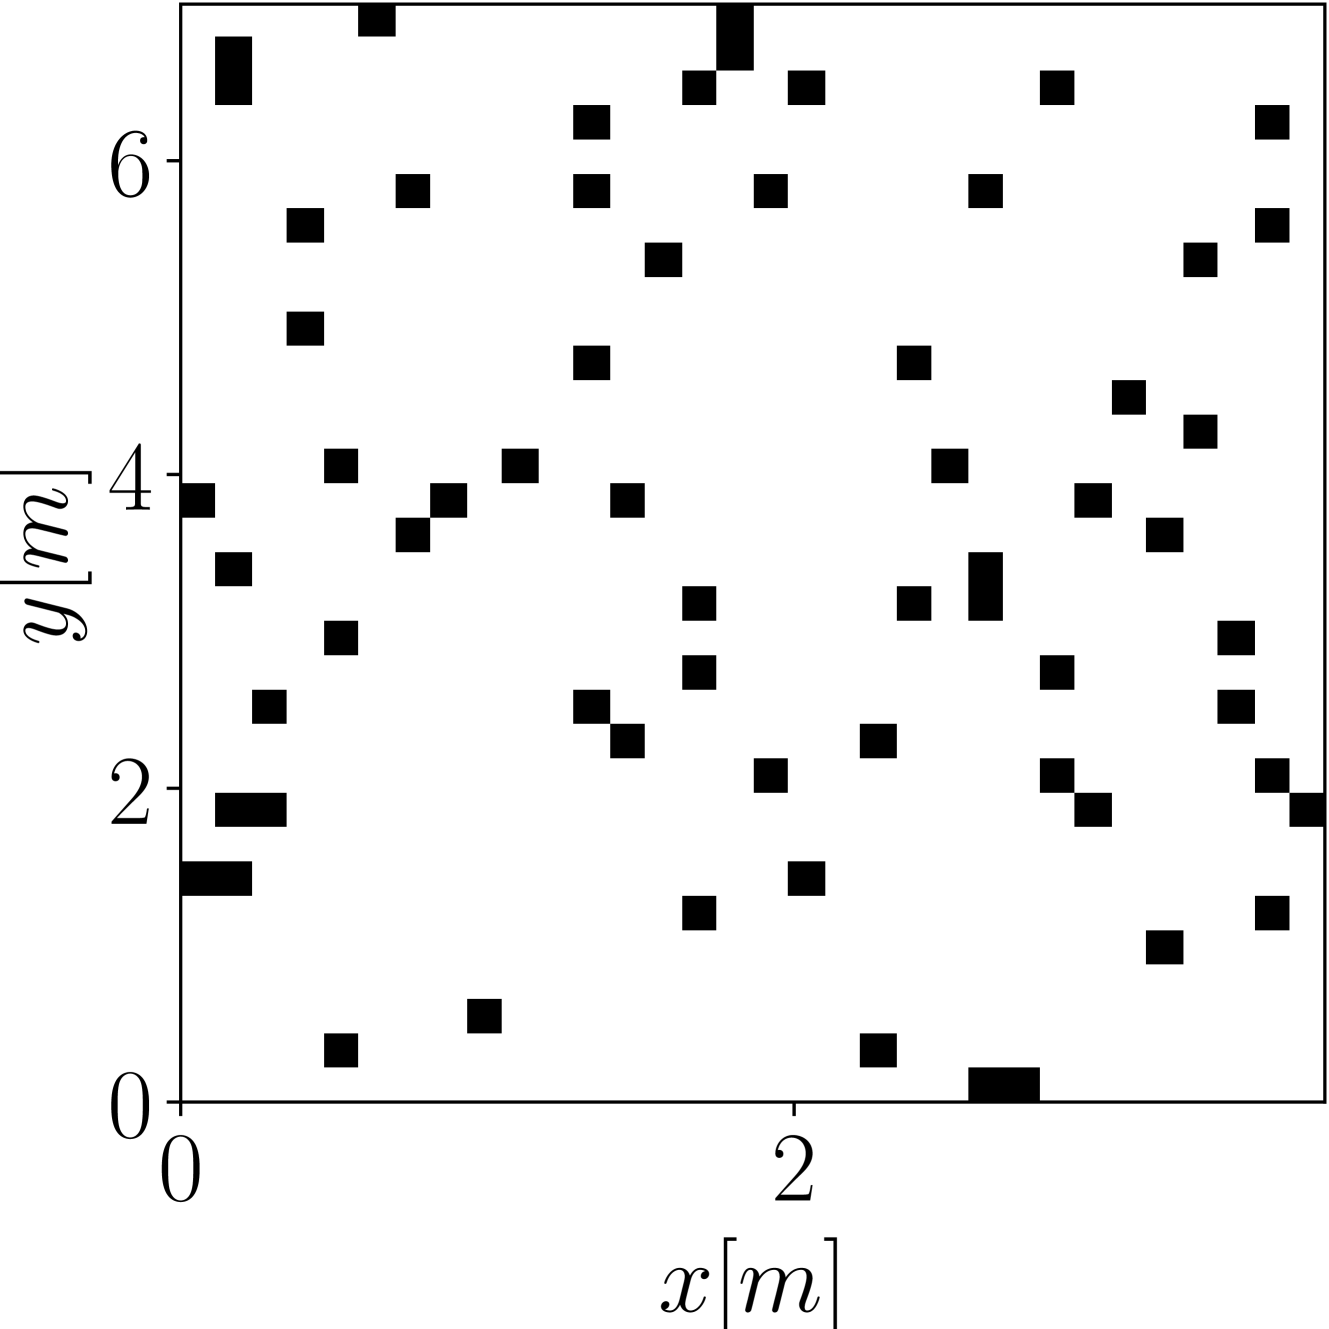
The image depicts a scatter plot with black square data points distributed across a white background. The axes are labeled with "x[m]" (horizontal) and "y[m]" (vertical), both ranging from 0 to 6. The data points are irregularly spaced, with no discernible pattern or trend. Some clusters of points are visible, while others are isolated.
### Components/Axes
- **X-axis**: Labeled "x[m]" with a linear scale from 0 to 6.
- **Y-axis**: Labeled "y[m]" with a linear scale from 0 to 6.
- **Data Points**: Black squares of uniform size, positioned at discrete (x, y) coordinates. No legend or color coding is present to indicate categories or variables.
### Detailed Analysis
- **Axis Labels**: The axes are explicitly labeled with "x[m]" and "y[m]", suggesting measurements in meters. The scales are linear, with ticks at 0, 2, 4, and 6.
- **Data Distribution**:
- Points are scattered across the plot, with no clear linear, exponential, or polynomial trend.
- Clusters are observed near:
- (x ≈ 0–1, y ≈ 2)
- (x ≈ 2–3, y ≈ 4)
- (x ≈ 4–5, y ≈ 6)
- Isolated points are distributed throughout the remaining space.
- **No Textual Elements**: No embedded text, annotations, or legends are visible.
### Key Observations
- **Randomness**: The distribution of points appears random, with no obvious correlation between x and y values.
- **Clustering**: Three distinct clusters are visible, but their significance is unclear without additional context.
- **Uniformity**: All data points are identical in size and color, suggesting a single variable or measurement type.
### Interpretation
The scatter plot likely represents a spatial or coordinate-based dataset, but the lack of contextual information (e.g., units, variables, or purpose) limits interpretability. The clusters may indicate localized groupings, but their relevance depends on the underlying data's nature. The absence of a legend or color coding prevents further categorization. The plot could be used to visualize spatial patterns, but its utility is constrained by the lack of explanatory details.