## Chart Type: Log-Log Eigenvalue Decay Plots
### Overview
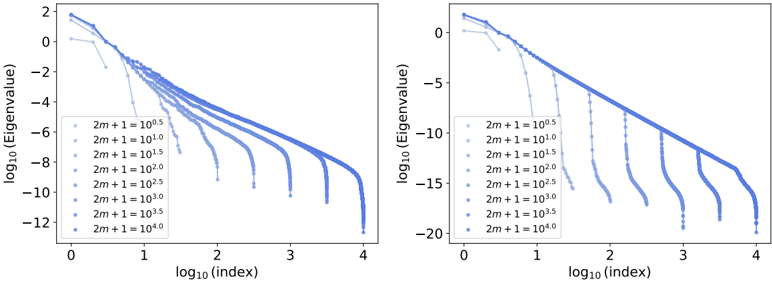
The image contains two log-log plots showing the decay of eigenvalues as a function of index for different values of the parameter "2m+1". The plots display the logarithm base 10 of the eigenvalue versus the logarithm base 10 of the index. Each plot contains multiple curves, each corresponding to a different value of "2m+1", ranging from 10^0.5 to 10^4.0. The plots appear to show the eigenvalue decay for two different systems or conditions.
### Components/Axes
* **X-axis (Horizontal):** log₁₀(index). The x-axis ranges from 0 to 4 in both plots.
* **Y-axis (Vertical):** log₁₀(Eigenvalue). The y-axis ranges from approximately -12 to 2 in the left plot and from -20 to 0 in the right plot.
* **Legend (Left Side of Left Plot and Right Plot):** The legend identifies each curve by the value of "2m+1". The values are:
* 2m + 1 = 10⁰.⁵
* 2m + 1 = 10¹.⁰
* 2m + 1 = 10¹.⁵
* 2m + 1 = 10².⁰
* 2m + 1 = 10².⁵
* 2m + 1 = 10³.⁰
* 2m + 1 = 10³.⁵
* 2m + 1 = 10⁴.⁰
### Detailed Analysis
**Left Plot:**
* **2m + 1 = 10⁰.⁵ (Lightest Blue):** Starts at approximately log₁₀(Eigenvalue) = 1.8 at log₁₀(index) = 0, decreases to approximately -2 at log₁₀(index) = 1, then drops off rapidly.
* **2m + 1 = 10¹.⁰:** Starts at approximately log₁₀(Eigenvalue) = 0.5 at log₁₀(index) = 0, decreases to approximately -4 at log₁₀(index) = 1.5, then drops off rapidly.
* **2m + 1 = 10¹.⁵:** Starts at approximately log₁₀(Eigenvalue) = -1 at log₁₀(index) = 0, decreases to approximately -6 at log₁₀(index) = 2, then drops off rapidly.
* **2m + 1 = 10².⁰:** Starts at approximately log₁₀(Eigenvalue) = -2.5 at log₁₀(index) = 0, decreases to approximately -8 at log₁₀(index) = 2.5, then drops off rapidly.
* **2m + 1 = 10².⁵:** Starts at approximately log₁₀(Eigenvalue) = -4 at log₁₀(index) = 0, decreases to approximately -9 at log₁₀(index) = 3, then drops off rapidly.
* **2m + 1 = 10³.⁰:** Starts at approximately log₁₀(Eigenvalue) = -5.5 at log₁₀(index) = 0, decreases to approximately -10 at log₁₀(index) = 3.3, then drops off rapidly.
* **2m + 1 = 10³.⁵:** Starts at approximately log₁₀(Eigenvalue) = -7 at log₁₀(index) = 0, decreases to approximately -11 at log₁₀(index) = 3.6, then drops off rapidly.
* **2m + 1 = 10⁴.⁰ (Darkest Blue):** Starts at approximately log₁₀(Eigenvalue) = -8.5 at log₁₀(index) = 0, decreases to approximately -12 at log₁₀(index) = 3.8, then drops off rapidly.
**Right Plot:**
* **2m + 1 = 10⁰.⁵ (Lightest Blue):** Starts at approximately log₁₀(Eigenvalue) = 0 at log₁₀(index) = 0, decreases to approximately -4 at log₁₀(index) = 1, then drops off rapidly.
* **2m + 1 = 10¹.⁰:** Starts at approximately log₁₀(Eigenvalue) = -2 at log₁₀(index) = 0, decreases to approximately -6 at log₁₀(index) = 1.5, then drops off rapidly.
* **2m + 1 = 10¹.⁵:** Starts at approximately log₁₀(Eigenvalue) = -4 at log₁₀(index) = 0, decreases to approximately -8 at log₁₀(index) = 2, then drops off rapidly.
* **2m + 1 = 10².⁰:** Starts at approximately log₁₀(Eigenvalue) = -6 at log₁₀(index) = 0, decreases to approximately -10 at log₁₀(index) = 2.5, then drops off rapidly.
* **2m + 1 = 10².⁵:** Starts at approximately log₁₀(Eigenvalue) = -8 at log₁₀(index) = 0, decreases to approximately -12 at log₁₀(index) = 3, then drops off rapidly.
* **2m + 1 = 10³.⁰:** Starts at approximately log₁₀(Eigenvalue) = -10 at log₁₀(index) = 0, decreases to approximately -14 at log₁₀(index) = 3.3, then drops off rapidly.
* **2m + 1 = 10³.⁵:** Starts at approximately log₁₀(Eigenvalue) = -12 at log₁₀(index) = 0, decreases to approximately -16 at log₁₀(index) = 3.6, then drops off rapidly.
* **2m + 1 = 10⁴.⁰ (Darkest Blue):** Starts at approximately log₁₀(Eigenvalue) = -14 at log₁₀(index) = 0, decreases to approximately -18 at log₁₀(index) = 3.8, then drops off rapidly.
### Key Observations
* In both plots, as "2m+1" increases, the starting log₁₀(Eigenvalue) decreases.
* In both plots, the curves initially decay gradually, then exhibit a sharp drop-off at a certain index.
* The index at which the sharp drop-off occurs increases as "2m+1" increases.
* The right plot shows a steeper initial decay compared to the left plot.
* The range of log₁₀(Eigenvalue) is different between the two plots, suggesting different scales or properties of the systems being analyzed.
### Interpretation
The plots illustrate the eigenvalue decay behavior for different values of the parameter "2m+1". The parameter "2m+1" appears to control the magnitude of the eigenvalues and the point at which the eigenvalues rapidly decay. The two plots likely represent different systems or conditions, as evidenced by the different ranges of the y-axis and the varying steepness of the initial decay. The rapid drop-off in eigenvalues suggests a transition or cutoff point in the system's behavior. The data suggests that increasing "2m+1" leads to a suppression of higher-index eigenvalues, potentially indicating a change in the system's complexity or dimensionality. The plots are useful for understanding how the parameter "2m+1" influences the eigenvalue spectrum and, consequently, the properties of the system being modeled.