\n
## Bar Chart with Line Overlay: E-CARE: Avg. Uncertainty
### Overview
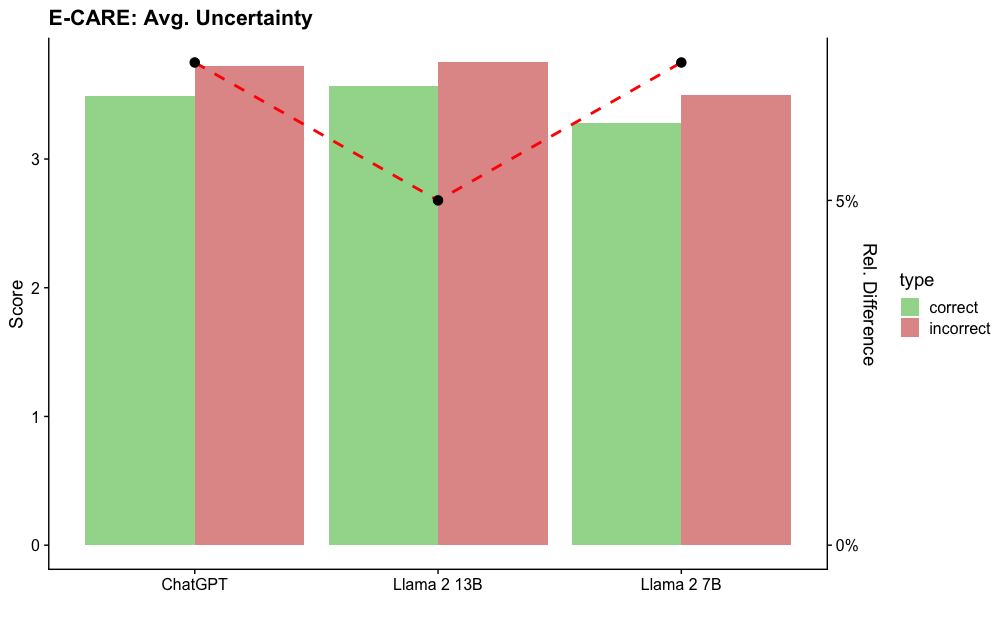
This is a grouped bar chart with a secondary axis line overlay. It compares the average uncertainty scores for correct versus incorrect responses across three different AI models: ChatGPT, Llama 2 13B, and Llama 2 7B. A dashed red line plots the relative percentage difference between the incorrect and correct scores for each model.
### Components/Axes
* **Title:** "E-CARE: Avg. Uncertainty" (Top-left corner).
* **Primary Y-Axis (Left):**
* **Label:** "Score"
* **Scale:** Linear, from 0 to 3, with major ticks at 0, 1, 2, 3.
* **Secondary Y-Axis (Right):**
* **Label:** "Rel. Difference"
* **Scale:** Percentage, from 0% to 5%, with major ticks at 0% and 5%.
* **X-Axis:**
* **Categories (from left to right):** "ChatGPT", "Llama 2 13B", "Llama 2 7B".
* **Legend (Centered on the right side):**
* **Title:** "type"
* **Green square:** "correct"
* **Red square:** "incorrect"
* **Data Series:**
1. **Grouped Bars:** Two bars per x-axis category.
* Left bar (Green): Represents the average uncertainty score for "correct" responses.
* Right bar (Red): Represents the average uncertainty score for "incorrect" responses.
2. **Line Overlay:** A red dashed line connecting black circular data points. Each point is positioned above its corresponding model group and corresponds to the "Rel. Difference" (right y-axis).
### Detailed Analysis
**Bar Values (Approximate Scores from Left Y-Axis):**
* **ChatGPT:**
* Correct (Green): ~3.5
* Incorrect (Red): ~3.7
* **Llama 2 13B:**
* Correct (Green): ~3.6
* Incorrect (Red): ~3.8
* **Llama 2 7B:**
* Correct (Green): ~3.3
* Incorrect (Red): ~3.5
**Line Data Points (Approximate Relative Difference from Right Y-Axis):**
* **ChatGPT:** The black dot is positioned slightly above the 5% tick mark, at approximately **5.5%**.
* **Llama 2 13B:** The black dot is positioned below the 5% tick mark, at approximately **4.5%**.
* **Llama 2 7B:** The black dot is positioned slightly above the 5% tick mark, at approximately **5.5%**.
**Trend Verification:**
* **Bar Trend:** For all three models, the red bar (incorrect) is taller than the green bar (correct), indicating higher average uncertainty scores for incorrect answers.
* **Line Trend:** The red dashed line starts high for ChatGPT (~5.5%), dips to its lowest point for Llama 2 13B (~4.5%), and rises back to a similar high level for Llama 2 7B (~5.5%). This creates a shallow "V" shape.
### Key Observations
1. **Consistent Pattern:** Across all models, incorrect responses are associated with higher measured uncertainty than correct responses.
2. **Model Comparison:** Llama 2 13B shows the smallest relative difference (~4.5%) between correct and incorrect uncertainty scores, while ChatGPT and Llama 2 7B show a larger, nearly identical difference (~5.5%).
3. **Absolute Scores:** The absolute uncertainty scores (left axis) are relatively high (all above 3 on a scale that appears to max at or above 3.8) and vary less between models than the relative difference does.
4. **Visual Emphasis:** The chart uses a dual-axis design to simultaneously show absolute values (bars) and a derived comparative metric (line), highlighting the relationship between the two.
### Interpretation
The data suggests a strong correlation between a model's expressed uncertainty (as measured by the E-CARE metric) and the correctness of its output. Higher uncertainty scores are a reliable indicator of potential incorrectness across these models.
The **relative difference** metric (the line) provides a normalized view of this gap. The fact that Llama 2 13B has a smaller relative difference could imply one of two things, or a combination:
1. **Better Calibration:** Its uncertainty estimates might be more finely tuned, making the distinction between correct and incorrect states less dramatic in terms of raw score.
2. **Different Operating Range:** Its overall uncertainty scores might be shifted, making the absolute gap similar but the percentage difference smaller.
The nearly identical relative difference for ChatGPT and Llama 2 7B, despite potential differences in their architecture and training, suggests this ~5.5% gap might be a common characteristic or a benchmark result for this type of evaluation. The chart effectively argues that monitoring model uncertainty is a valuable signal for assessing answer reliability, with the specific magnitude of the signal varying by model.