## Heatmap: Baseline - Long-to-Short - Qwen-2.5 7B
### Overview
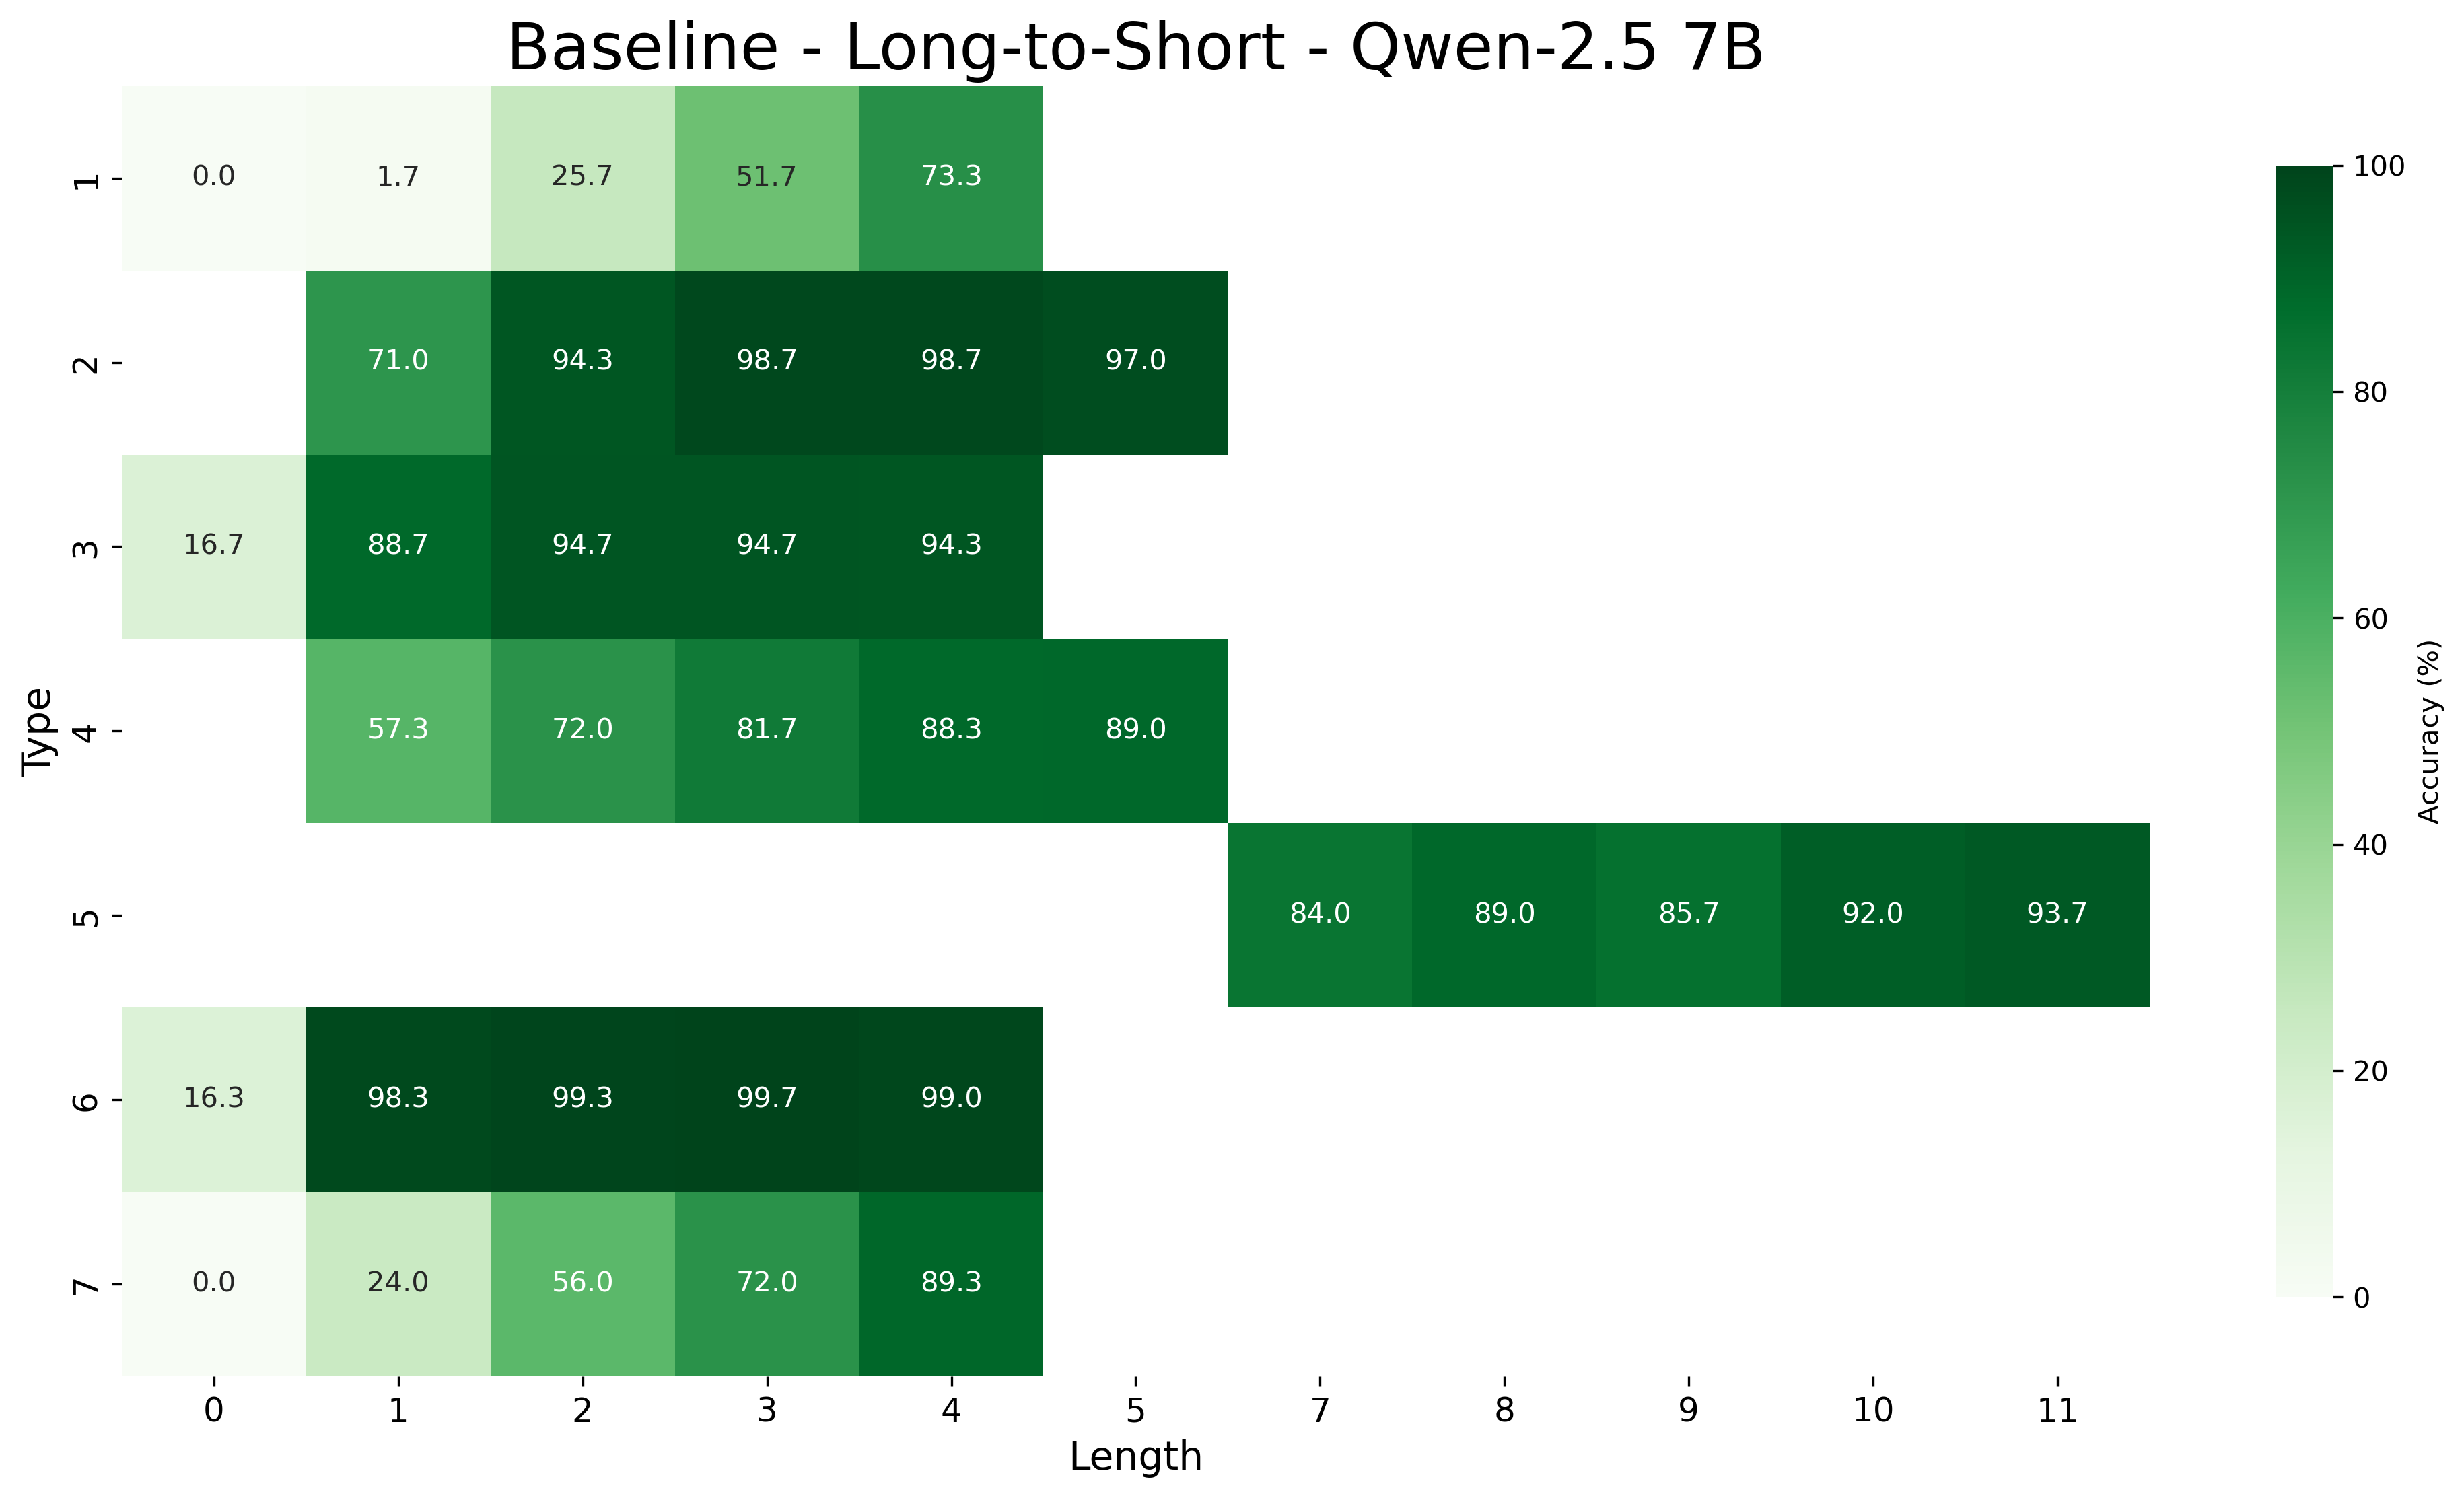
The image is a heatmap displaying accuracy percentages for a model named "Qwen-2.5 7B" under "Baseline - Long-to-Short" conditions. The heatmap visualizes the relationship between "Type" (categorical, 7 types) and "Length" (numerical, ranging from 0 to 11). The color intensity represents the accuracy percentage, with darker green indicating higher accuracy and lighter green indicating lower accuracy.
### Components/Axes
* **Title:** Baseline - Long-to-Short - Qwen-2.5 7B
* **X-axis:** Length, with values ranging from 0 to 11.
* **Y-axis:** Type, with values ranging from 1 to 7.
* **Color Bar (Right):** Accuracy (%), ranging from 0 to 100. The color gradient goes from light green (0%) to dark green (100%).
### Detailed Analysis
The heatmap presents accuracy values for each combination of "Type" and "Length." The values are as follows:
* **Type 1:**
* Length 0: 0.0%
* Length 1: 1.7%
* Length 2: 25.7%
* Length 3: 51.7%
* Length 4: 73.3%
* **Type 2:**
* Length 1: 71.0%
* Length 2: 94.3%
* Length 3: 98.7%
* Length 4: 98.7%
* Length 5: 97.0%
* **Type 3:**
* Length 0: 16.7%
* Length 1: 88.7%
* Length 2: 94.7%
* Length 3: 94.7%
* Length 4: 94.3%
* **Type 4:**
* Length 0: 57.3%
* Length 1: 72.0%
* Length 2: 81.7%
* Length 3: 88.3%
* Length 4: 89.0%
* **Type 5:**
* Length 7: 84.0%
* Length 8: 89.0%
* Length 9: 85.7%
* Length 10: 92.0%
* Length 11: 93.7%
* **Type 6:**
* Length 0: 16.3%
* Length 1: 98.3%
* Length 2: 99.3%
* Length 3: 99.7%
* Length 4: 99.0%
* **Type 7:**
* Length 0: 0.0%
* Length 1: 24.0%
* Length 2: 56.0%
* Length 3: 72.0%
* Length 4: 89.3%
### Key Observations
* Types 2, 3, and 6 generally exhibit high accuracy (above 70%) for the lengths they cover.
* Types 1 and 7 show lower accuracy, especially at shorter lengths.
* Type 5 only has data for lengths 7-11, with relatively high accuracy.
* Accuracy tends to increase with length for Types 1, 4, and 7, at least up to length 4.
### Interpretation
The heatmap provides a visual representation of the model's performance across different "Types" and "Lengths." The data suggests that the model performs better on certain types and longer lengths. The lower accuracy for Types 1 and 7 at shorter lengths could indicate a weakness in handling those specific types of inputs when the input sequence is short. The high accuracy for Types 2, 3, and 6 suggests that the model is well-suited for those types of inputs. The data for Type 5, which only covers longer lengths, indicates that the model maintains good accuracy for those lengths. The increasing accuracy with length for some types suggests that the model benefits from longer input sequences for those specific types.