## Heatmap: Baseline - Long-to-Short - Qwen-2.5 7B
### Overview
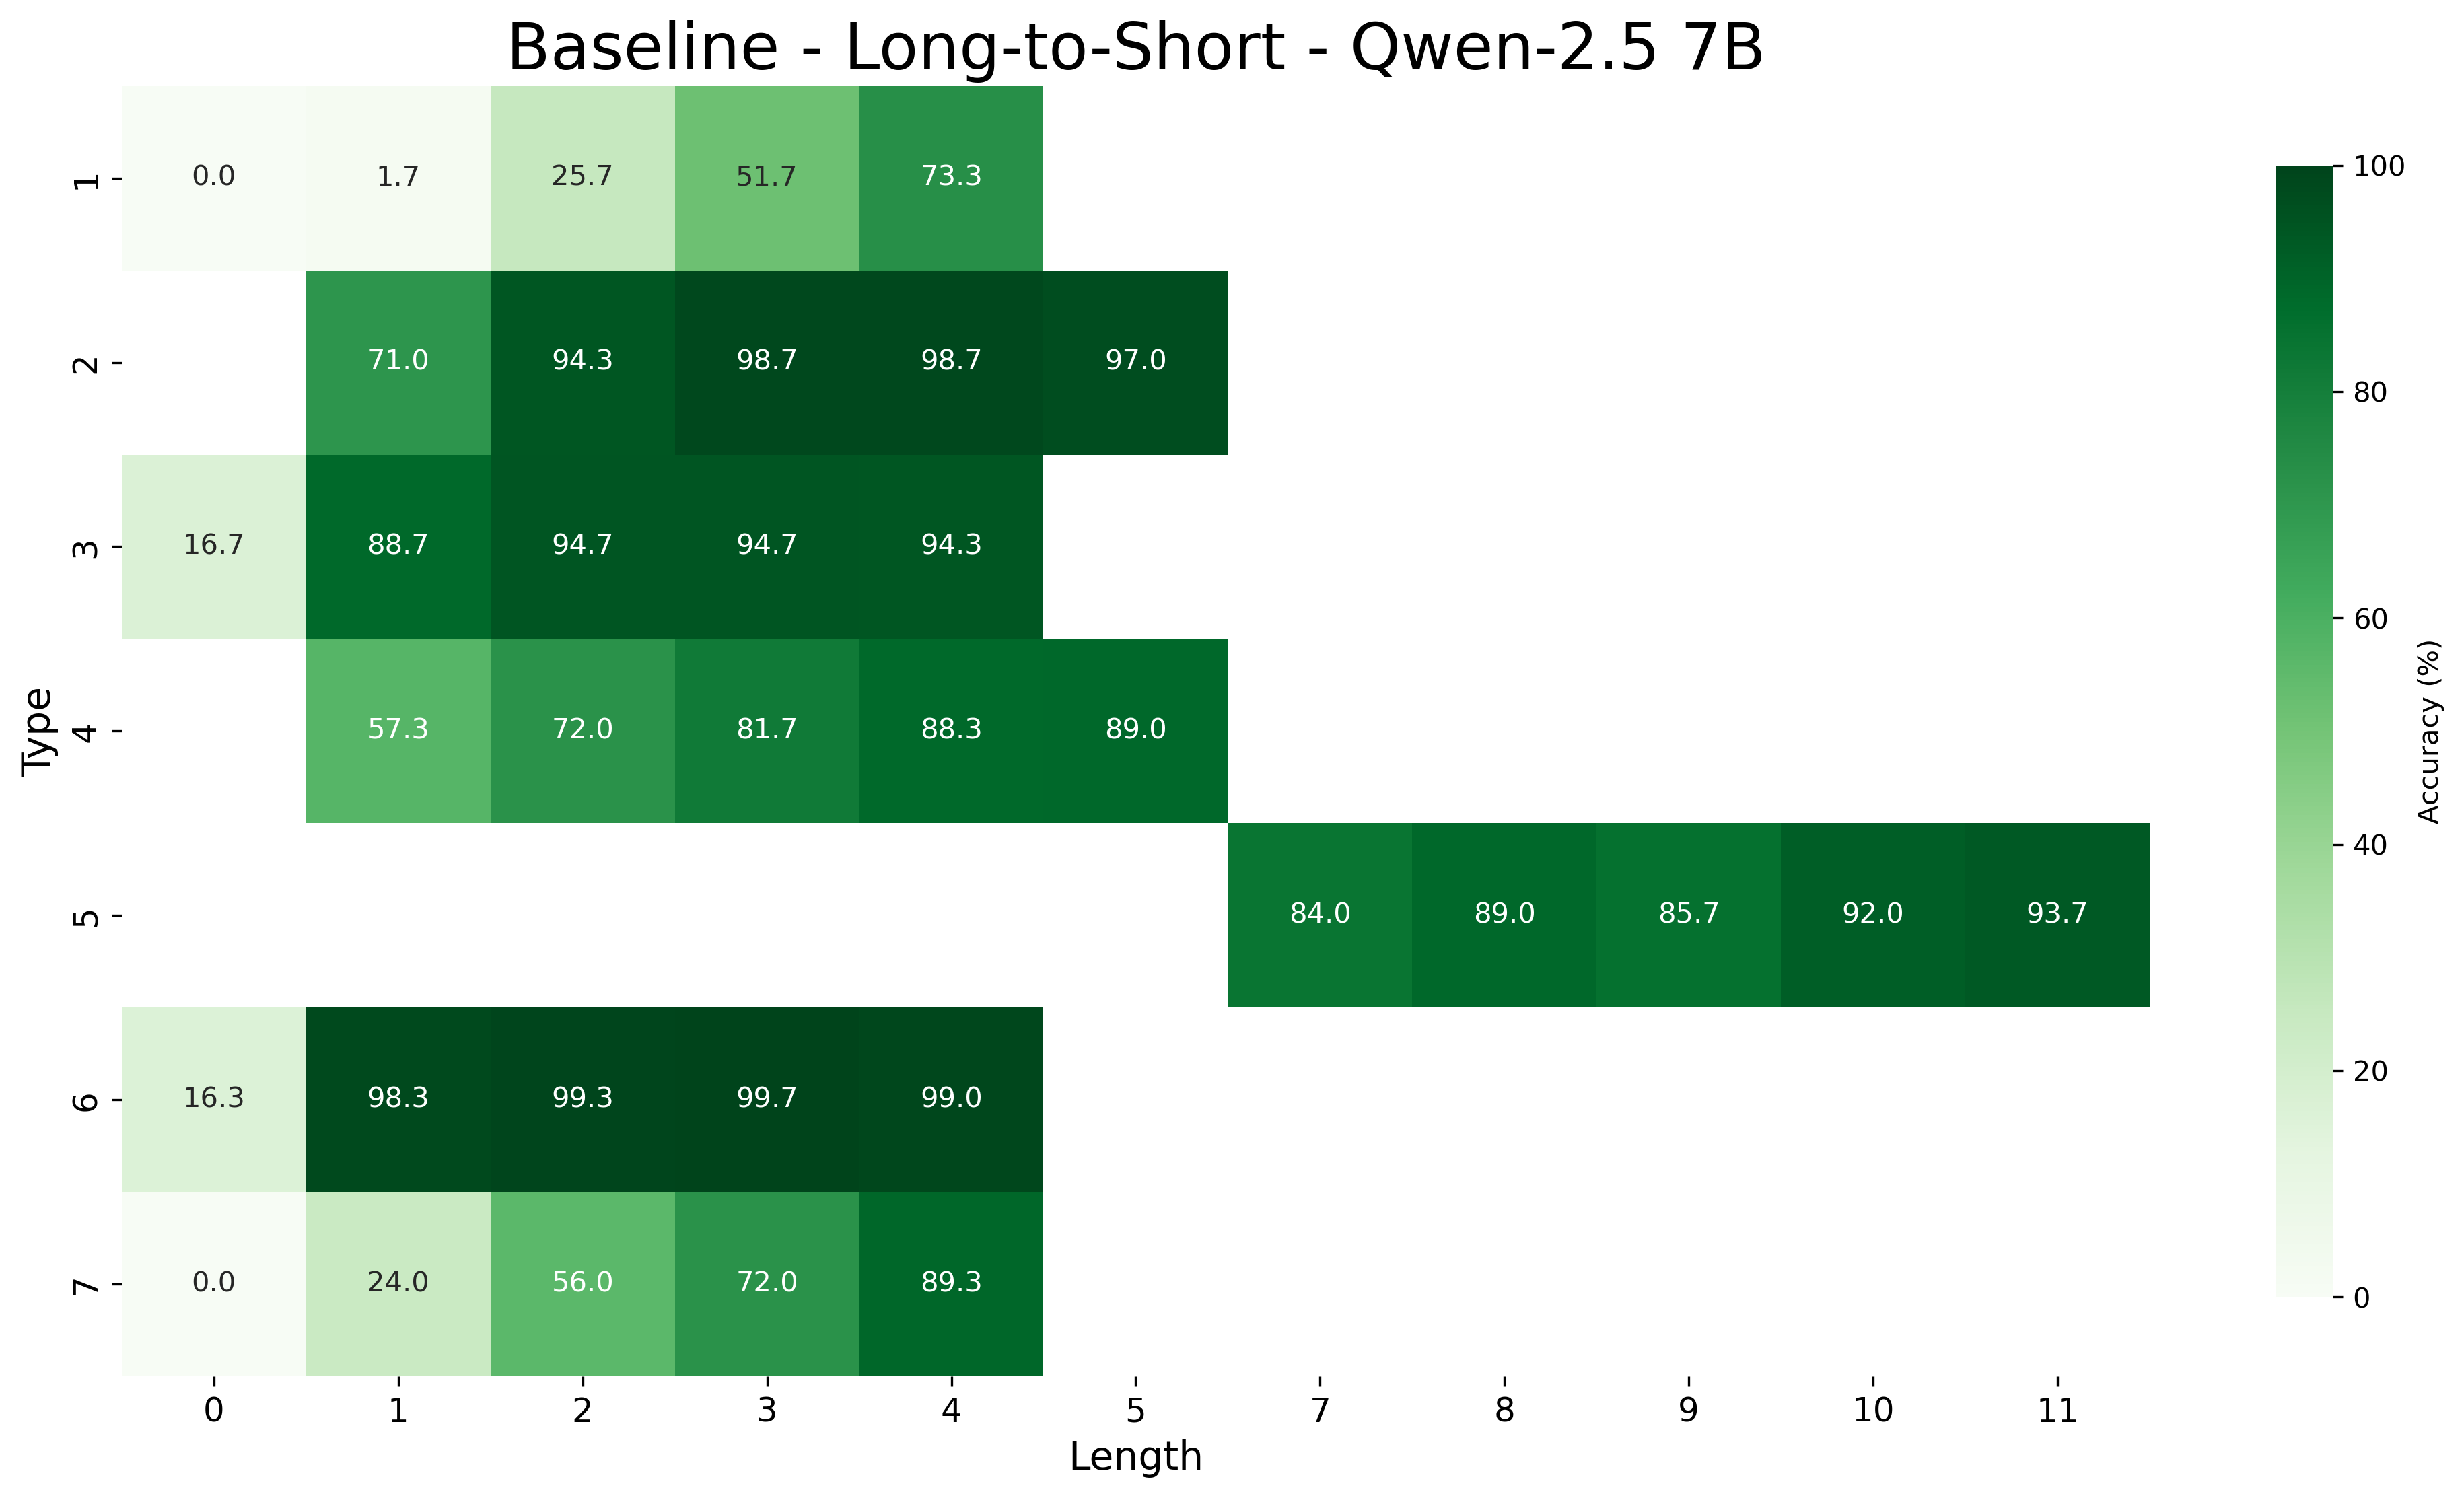
This image is a heatmap visualizing the accuracy (in percentage) of a model named "Qwen-2.5 7B" on a "Long-to-Short" task. The performance is broken down by two categorical variables: "Type" (y-axis) and "Length" (x-axis). The color intensity represents accuracy, with a scale from light green (0%) to dark green (100%).
### Components/Axes
* **Title:** "Baseline - Long-to-Short - Qwen-2.5 7B" (centered at the top).
* **Y-Axis (Vertical):** Labeled "Type". It lists 7 distinct categories, numbered 1 through 7.
* **X-Axis (Horizontal):** Labeled "Length". It lists discrete numerical values: 0, 1, 2, 3, 4, 5, 7, 8, 9, 10, 11. Note the gap between 5 and 7.
* **Color Bar/Legend:** Located on the right side. It is a vertical gradient bar labeled "Accuracy (%)". The scale runs from 0 (lightest green) at the bottom to 100 (darkest green) at the top, with tick marks at 20, 40, 60, and 80.
* **Data Cells:** The main body of the chart is a grid where each cell corresponds to a specific (Type, Length) pair. The cell's background color corresponds to the accuracy value, which is also printed as a number within the cell.
### Detailed Analysis
The following table reconstructs the data from the heatmap. Empty cells indicate no data point for that (Type, Length) combination.
| Type | Length 0 | Length 1 | Length 2 | Length 3 | Length 4 | Length 5 | Length 7 | Length 8 | Length 9 | Length 10 | Length 11 |
| :--- | :--- | :--- | :--- | :--- | :--- | :--- | :--- | :--- | :--- | :--- | :--- |
| **1** | 0.0 | 1.7 | 25.7 | 51.7 | 73.3 | | | | | | |
| **2** | | 71.0 | 94.3 | 98.7 | 98.7 | 97.0 | | | | | |
| **3** | 16.7 | 88.7 | 94.7 | 94.7 | 94.3 | | | | | | |
| **4** | | 57.3 | 72.0 | 81.7 | 88.3 | 89.0 | | | | | |
| **5** | | | | | | | 84.0 | 89.0 | 85.7 | 92.0 | 93.7 |
| **6** | 16.3 | 98.3 | 99.3 | 99.7 | 99.0 | | | | | | |
| **7** | 0.0 | 24.0 | 56.0 | 72.0 | 89.3 | | | | | | |
**Trend Verification per Type:**
* **Type 1:** Shows a strong, steady upward trend. Accuracy starts at 0.0% (Length 0) and increases monotonically to 73.3% (Length 4).
* **Type 2:** Starts high (71.0% at Length 1), peaks at 98.7% (Lengths 3 & 4), and shows a very slight decrease to 97.0% at Length 5.
* **Type 3:** Jumps dramatically from 16.7% (Length 0) to 88.7% (Length 1), then plateaus in the mid-90s.
* **Type 4:** Exhibits a consistent upward trend from 57.3% (Length 1) to 89.0% (Length 5).
* **Type 5:** Data exists only for longer lengths (7-11). Accuracy fluctuates between 84.0% and 93.7%, with a general upward trend from Length 7 to 11.
* **Type 6:** Starts low (16.3% at Length 0) but immediately jumps to near-perfect accuracy (98.3% at Length 1) and remains above 99% for Lengths 2-4.
* **Type 7:** Mirrors the trend of Type 1, starting at 0.0% (Length 0) and increasing steadily to 89.3% (Length 4).
### Key Observations
1. **Length-Dependent Performance:** For Types 1, 4, and 7, accuracy improves significantly and consistently as the "Length" value increases.
2. **High Baseline Performance:** Types 2, 3, and 6 achieve very high accuracy (>88%) starting from relatively short lengths (Length 1 or 2).
3. **Outlier - Type 5:** This type has no data for lengths 0-6, suggesting it may represent a different category of task or input that only applies to longer sequences. Its performance is consistently high within its range.
4. **Near-Perfect Accuracy:** Type 6 at Lengths 2, 3, and 4 shows accuracy values of 99.3%, 99.7%, and 99.0%, indicating near-perfect performance for those conditions.
5. **Zero Accuracy Points:** Types 1 and 7 both have an accuracy of 0.0% at Length 0, indicating complete failure for that specific condition.
### Interpretation
This heatmap provides a granular view of the Qwen-2.5 7B model's performance on a "Long-to-Short" task, revealing that its effectiveness is highly dependent on both the task "Type" and the input "Length."
* **Task Difficulty Spectrum:** The "Type" axis likely represents different sub-tasks or problem categories. The data suggests a spectrum of difficulty: Types 1 and 7 appear to be the most challenging at short lengths, requiring longer inputs to achieve decent accuracy. In contrast, Types 2, 3, and 6 seem to be easier or better-suited to the model, as they yield high accuracy even with short inputs.
* **The "Long-to-Short" Mechanism:** The general trend of improving accuracy with increasing length for most types supports the premise of a "Long-to-Short" process—perhaps the model uses longer context or reasoning chains to generate a correct short answer. The plateau or slight dip for Type 2 at Length 5 might indicate a point of diminishing returns or a minor failure mode.
* **Model Specialization:** The exceptional performance of Type 6 (near 100% accuracy) suggests the model is particularly adept at that specific type of task. Conversely, the 0% accuracy for Types 1 and 7 at Length 0 highlights a critical failure case for very short inputs of those types.
* **Data Gaps:** The absence of data for Type 5 at shorter lengths and for all types at lengths 6 and beyond (except Type 5) is notable. It implies the evaluation was either not performed for those combinations or that those combinations are not applicable, which is important context for understanding the model's full capabilities.
In summary, the chart demonstrates that the Qwen-2.5 7B model's accuracy on this task is not uniform but is a complex function of task type and input length, with clear patterns of strength and weakness across different conditions.