# Technical Document Extraction: Heatmap Analysis
## Title
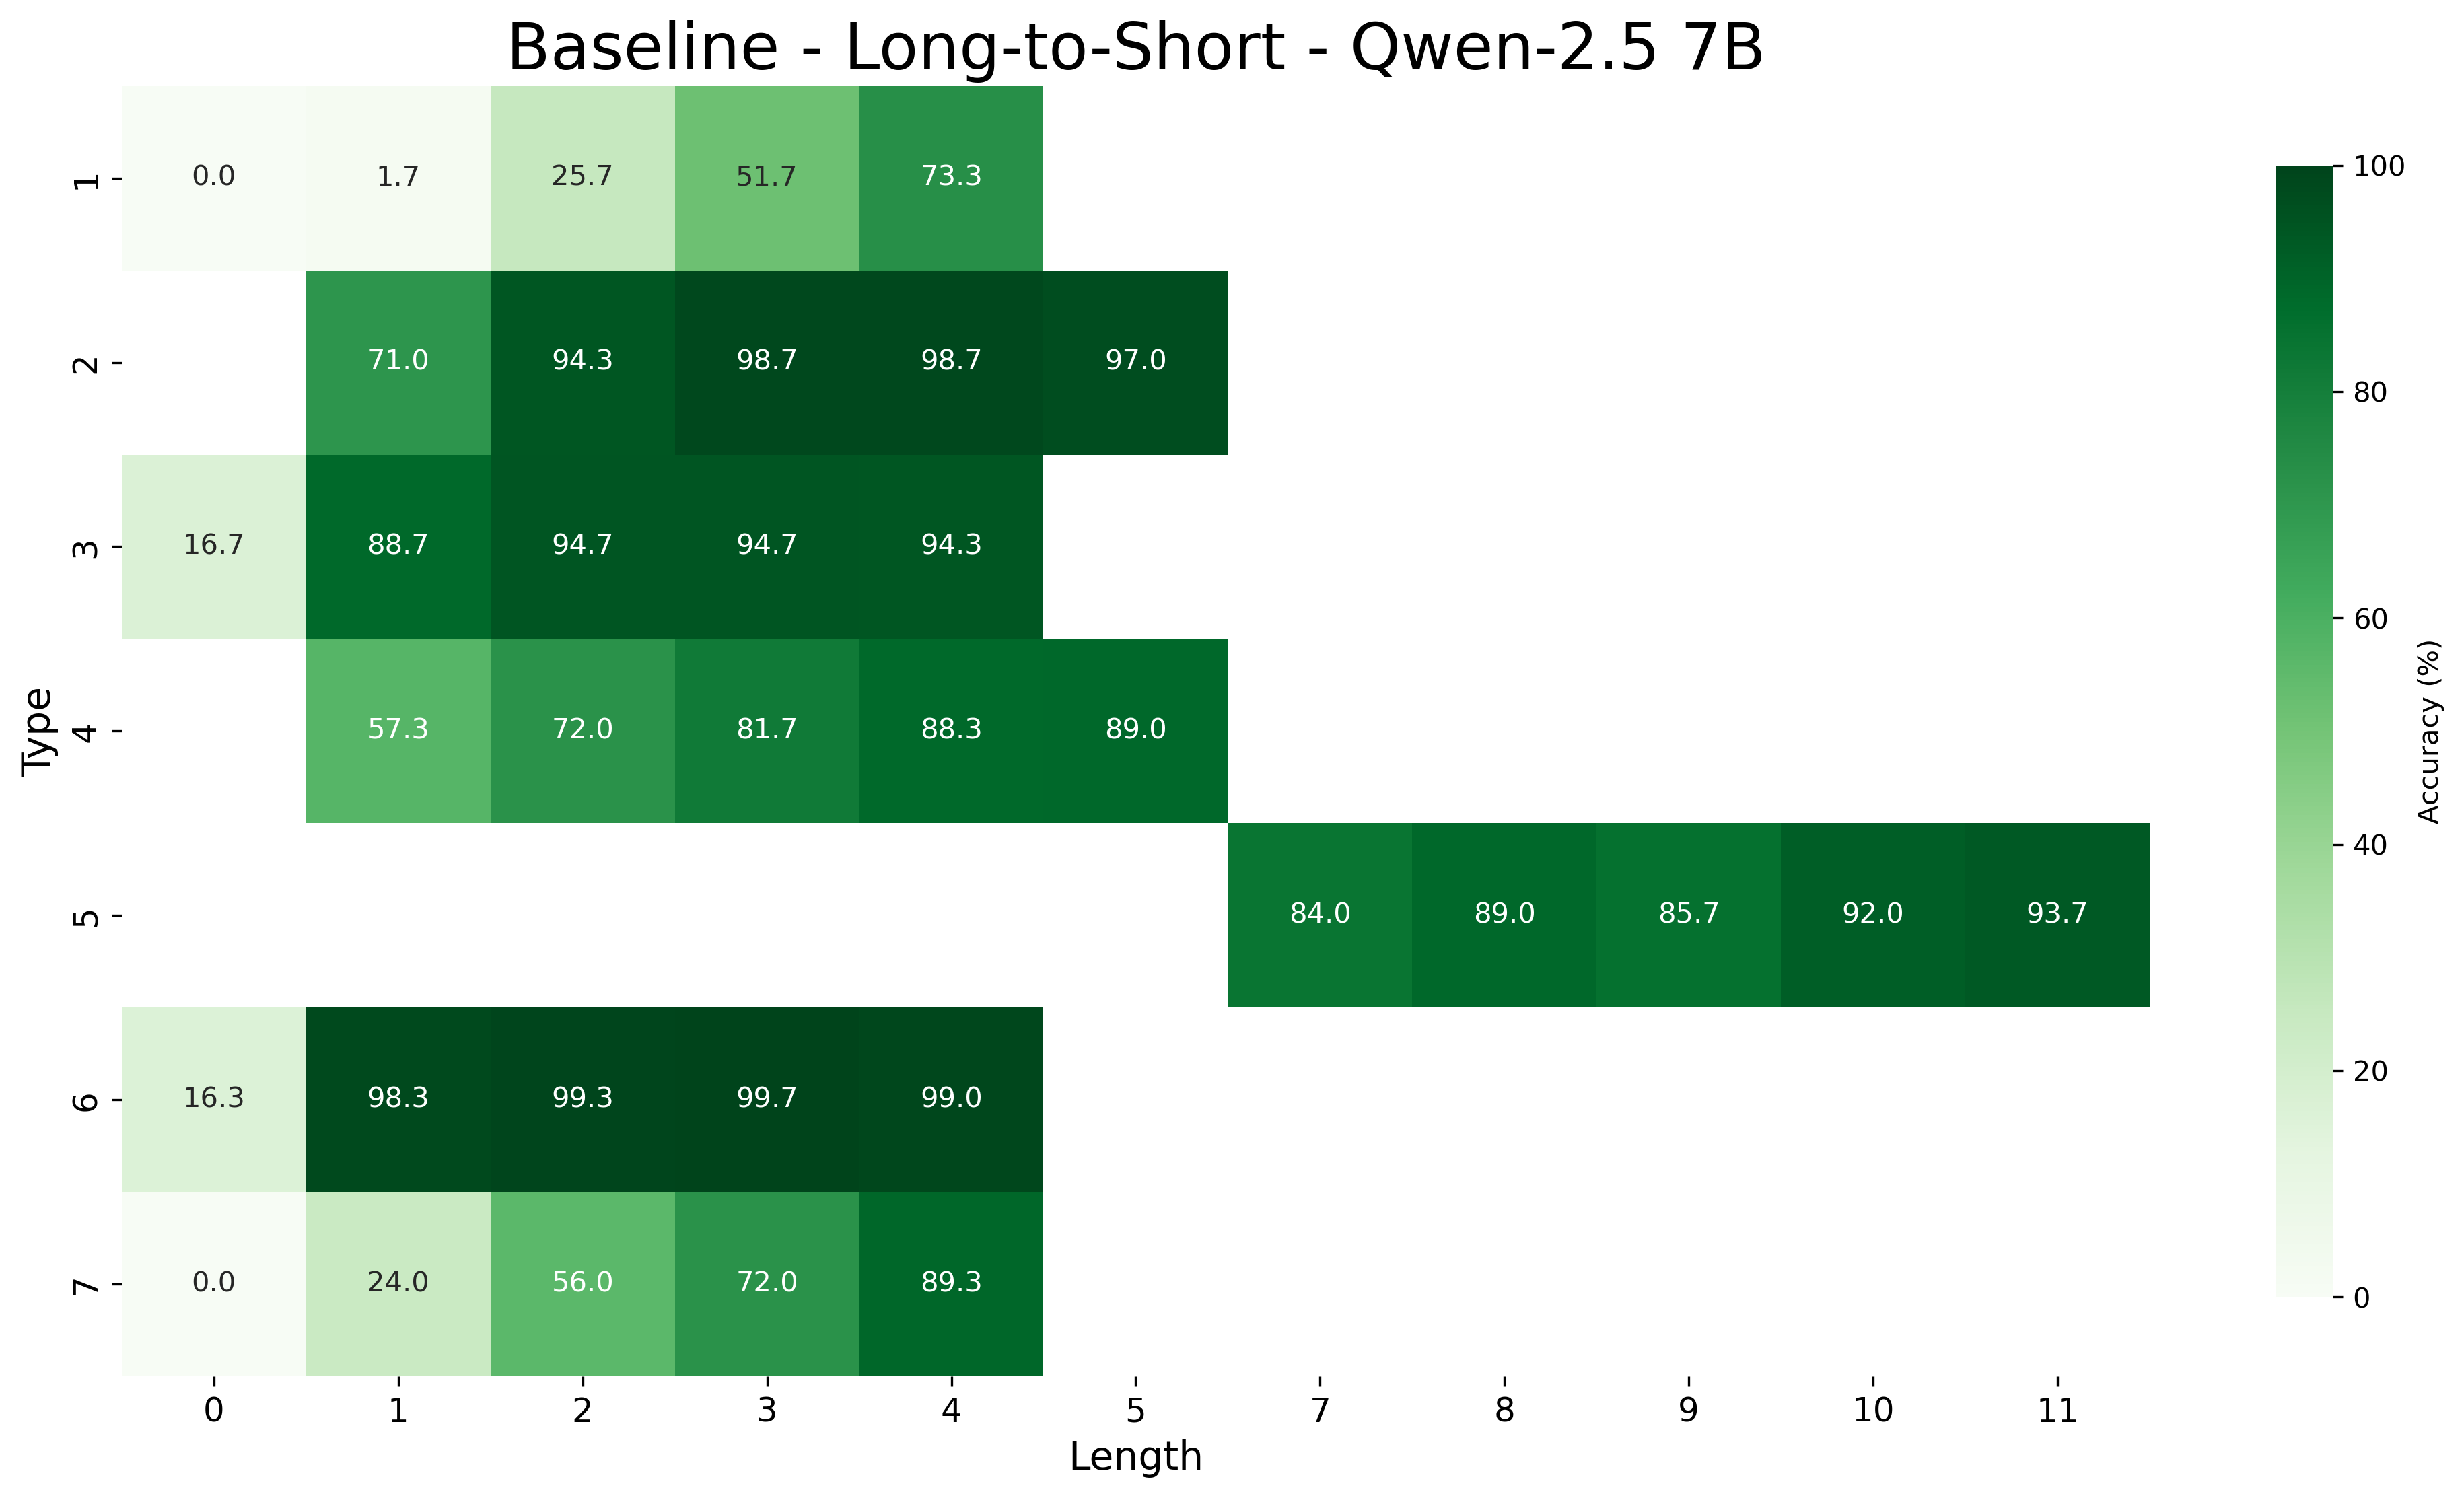
**Baseline - Long-to-Short - Qwen-2.5 7B**
---
## Axis Labels
- **X-axis (Horizontal):** `Length` (values: 0 to 11)
- **Y-axis (Vertical):** `Type` (values: 0 to 7)
- **Colorbar (Right):** `Accuracy (%)` (range: 0% to 100%)
---
## Data Structure
The heatmap represents accuracy percentages for combinations of `Type` (rows) and `Length` (columns). Each cell contains a numerical value corresponding to accuracy.
### Reconstructed Data Table
| Type \ Length | 0 | 1 | 2 | 3 | 4 | 5 | 6 | 7 | 8 | 9 | 10 | 11 |
|---------------|------|------|------|------|------|------|------|------|------|------|------|------|
| **0** | 0.0 | 1.7 | 25.7 | 51.7 | 73.3 | | | | | | | |
| **1** | | 71.0 | 94.3 | 98.7 | 98.7 | 97.0 | | | | | | |
| **2** | 16.7 | 88.7 | 94.7 | 94.7 | 94.3 | | | | | | | |
| **3** | | 57.3 | 72.0 | 81.7 | 88.3 | 89.0 | | | | | | |
| **4** | | | | | | | 84.0 | 89.0 | 85.7 | 92.0 | 93.7 |
| **5** | | | | | | | | | | | | |
| **6** | 16.3 | 98.3 | 99.3 | 99.7 | 99.0 | | | | | | | |
| **7** | 0.0 | 24.0 | 56.0 | 72.0 | 89.3 | | | | | | | |
---
## Key Trends
1. **General Pattern:** Accuracy increases with `Length` for most `Type` values, peaking around `Length = 4` before plateauing or declining.
2. **High Accuracy:**
- `Type 1` and `Type 6` achieve near-perfect accuracy (97–99%) for `Length ≥ 2`.
- `Type 4` and `Type 7` show moderate accuracy (70–90%) across most `Length` values.
3. **Low Accuracy:**
- `Type 0` and `Type 7` start with near-zero accuracy at `Length = 0`, improving sharply with increasing `Length`.
- `Type 5` has no data for `Length ≤ 6`.
---
## Color Legend Verification
- **Lightest Green (0–20%):** Matches `Type 0, Length 0` (0.0%) and `Type 7, Length 0` (0.0%).
- **Medium Green (40–60%):** Matches `Type 0, Length 2` (25.7%) and `Type 3, Length 2` (72.0%).
- **Dark Green (80–100%):** Matches `Type 1, Length 3` (98.7%) and `Type 6, Length 3` (99.7%).
---
## Spatial Grounding
- **Legend Position:** Right side of the heatmap.
- **Data Point Alignment:** All cell colors strictly correspond to the colorbar's accuracy scale.
---
## Component Isolation
1. **Header:** Title (`Baseline - Long-to-Short - Qwen-2.5 7B`).
2. **Main Chart:** 8x12 heatmap with labeled axes and embedded numerical values.
3. **Footer:** Colorbar (`Accuracy (%)` from 0% to 100%).
---
## Notes
- Missing values (e.g., `Type 5, Length ≤ 6`) are represented as empty cells.
- No non-English text is present in the image.