## Combined Line and Scatter Plots: Correlation Analysis of g(n)(0) and Density ρ(k)
### Overview
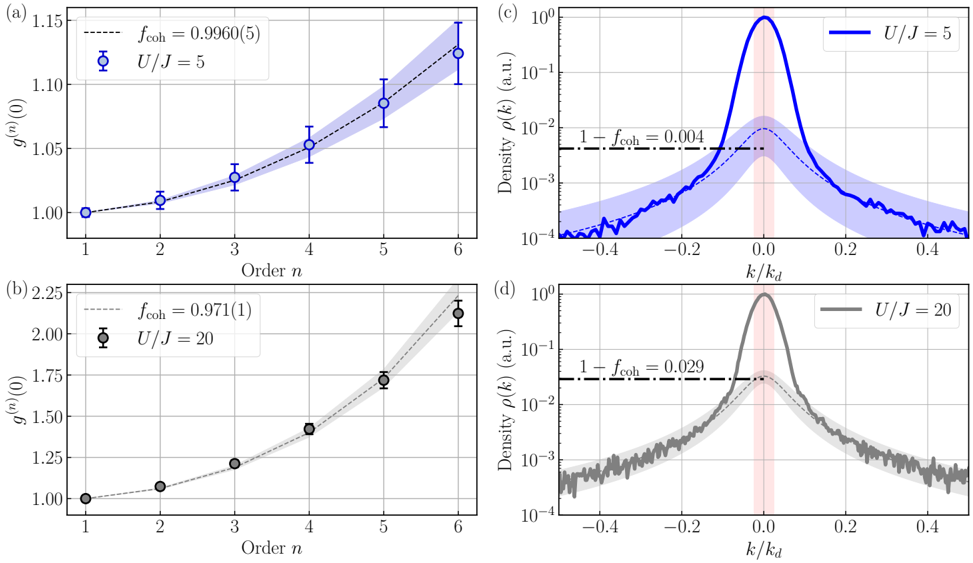
The image presents four plots arranged in a 2x2 grid. The top row (a and c) displays data for U/J = 5, while the bottom row (b and d) shows data for U/J = 20. Plots (a) and (b) are scatter plots showing the relationship between "Order n" and "g(n)(0)", with error bars and dashed trend lines. Plots (c) and (d) are line plots on a semi-log scale, showing "Density ρ(k)" as a function of "k/kd". Each line plot also includes a dashed horizontal line indicating "1 - fcoh".
### Components/Axes
**Plot (a):**
* **Type:** Scatter plot
* **Title:** (a) - located at the top-left corner of the plot.
* **X-axis:** Order n (values: 1 to 6)
* **Y-axis:** g(n)(0) (values: 1.00 to 1.15)
* **Data Series:**
* U/J = 5 (blue circles with error bars)
* fcoh = 0.9960(5) (dashed black line)
* **Legend:** Located at the top of the plot.
**Plot (b):**
* **Type:** Scatter plot
* **Title:** (b) - located at the top-left corner of the plot.
* **X-axis:** Order n (values: 1 to 6)
* **Y-axis:** g(n)(0) (values: 1.00 to 2.25)
* **Data Series:**
* U/J = 20 (gray circles with error bars)
* fcoh = 0.971(1) (dashed black line)
* **Legend:** Located at the top of the plot.
**Plot (c):**
* **Type:** Line plot (semi-log scale)
* **Title:** (c) - located at the top-left corner of the plot.
* **X-axis:** k/kd (values: -0.4 to 0.4)
* **Y-axis:** Density ρ(k) (a.u.) (values: 10^-4 to 10^0)
* **Data Series:**
* U/J = 5 (solid blue line with shaded region)
* 1 - fcoh = 0.004 (dashed black line)
* **Legend:** Located at the top of the plot.
**Plot (d):**
* **Type:** Line plot (semi-log scale)
* **Title:** (d) - located at the top-left corner of the plot.
* **X-axis:** k/kd (values: -0.4 to 0.4)
* **Y-axis:** Density ρ(k) (a.u.) (values: 10^-4 to 10^0)
* **Data Series:**
* U/J = 20 (solid gray line with shaded region)
* 1 - fcoh = 0.029 (dashed black line)
* **Legend:** Located at the top of the plot.
### Detailed Analysis
**Plot (a):**
* The blue data points (U/J = 5) show an upward trend.
* Order n = 1, g(n)(0) ≈ 1.00
* Order n = 2, g(n)(0) ≈ 1.01
* Order n = 3, g(n)(0) ≈ 1.03
* Order n = 4, g(n)(0) ≈ 1.05
* Order n = 5, g(n)(0) ≈ 1.09
* Order n = 6, g(n)(0) ≈ 1.12
* The dashed black line (fcoh = 0.9960(5)) also shows an upward trend, closely following the data points.
**Plot (b):**
* The gray data points (U/J = 20) show an upward trend.
* Order n = 1, g(n)(0) ≈ 1.00
* Order n = 2, g(n)(0) ≈ 1.08
* Order n = 3, g(n)(0) ≈ 1.22
* Order n = 4, g(n)(0) ≈ 1.42
* Order n = 5, g(n)(0) ≈ 1.73
* Order n = 6, g(n)(0) ≈ 2.15
* The dashed black line (fcoh = 0.971(1)) also shows an upward trend, closely following the data points.
**Plot (c):**
* The solid blue line (U/J = 5) shows a peak around k/kd = 0.
* At k/kd = 0, Density ρ(k) ≈ 10^0
* At k/kd = -0.4 and 0.4, Density ρ(k) ≈ 10^-4
* The dashed black line (1 - fcoh = 0.004) is horizontal.
**Plot (d):**
* The solid gray line (U/J = 20) shows a peak around k/kd = 0.
* At k/kd = 0, Density ρ(k) ≈ 10^0
* At k/kd = -0.4 and 0.4, Density ρ(k) ≈ 10^-4
* The dashed black line (1 - fcoh = 0.029) is horizontal.
### Key Observations
* In plots (a) and (b), g(n)(0) increases with Order n for both U/J = 5 and U/J = 20. The rate of increase appears higher for U/J = 20.
* In plots (c) and (d), the density ρ(k) peaks at k/kd = 0 for both U/J = 5 and U/J = 20. The peak appears sharper for U/J = 20.
* The values of "1 - fcoh" are different for U/J = 5 and U/J = 20.
### Interpretation
The plots suggest a correlation between the order 'n' and the function g(n)(0), with a steeper increase observed for U/J = 20 compared to U/J = 5. This indicates that the system's behavior is more sensitive to changes in 'n' when U/J is larger. The density plots show a central peak, indicating a higher probability of finding particles with momentum close to zero. The difference in "1 - fcoh" values suggests that the coherence properties of the system are influenced by the ratio U/J. Specifically, a higher U/J value (20) corresponds to a larger "1 - fcoh" value, which may indicate a decrease in coherence.