## Charts: Correlation Functions and Density Distributions
### Overview
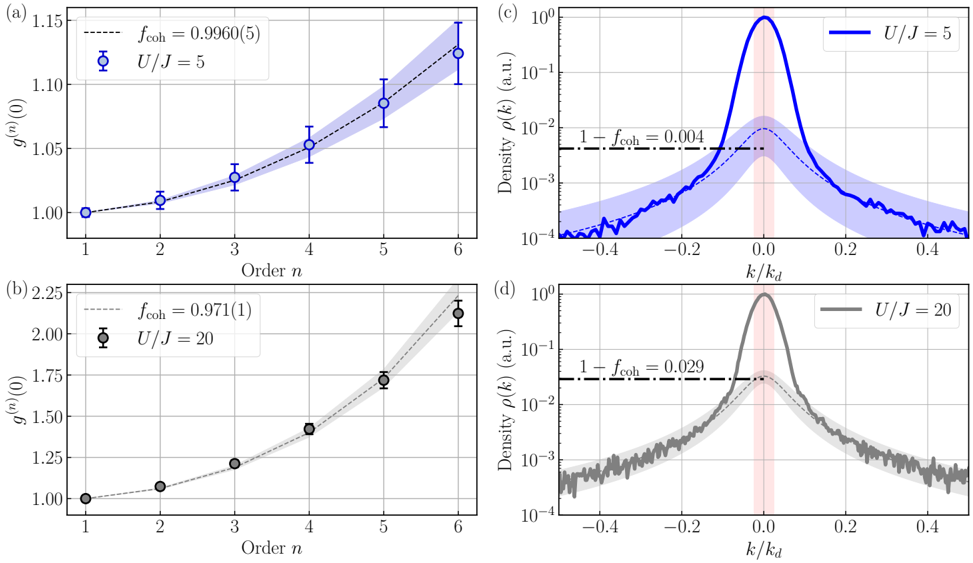
This image contains four sub-plots arranged in a 2x2 grid, labeled (a) through (d). These plots characterize the quantum properties of a system, likely a Bose-Einstein Condensate or a similar quantum gas, under two different interaction regimes defined by the ratio $U/J$ (interaction energy to tunneling energy).
* **Left Column (a, b):** Scatter plots showing the $n$-th order correlation function $g^{(n)}(0)$ as a function of the order $n$.
* **Right Column (c, d):** Line plots showing the density $\rho(k)$ as a function of normalized momentum $k/k_d$ on a logarithmic scale.
### Components/Axes
**Sub-plots (a) and (b):**
* **Y-axis:** $g^{(n)}(0)$ (dimensionless correlation function).
* **X-axis:** Order $n$ (integer values from 1 to 6).
* **Legend:**
* (a) Blue: $U/J = 5$, $f_{\text{coh}} = 0.9960(5)$.
* (b) Grey: $U/J = 20$, $f_{\text{coh}} = 0.971(1)$.
**Sub-plots (c) and (d):**
* **Y-axis:** Density $\rho(k)$ (a.u. - arbitrary units), logarithmic scale ranging from $10^{-4}$ to $10^0$.
* **X-axis:** $k/k_d$ (normalized momentum), ranging from approximately -0.5 to 0.5.
* **Legend:**
* (c) Blue: $U/J = 5$.
* (d) Grey: $U/J = 20$.
* **Annotations:** A horizontal dash-dotted line indicates the value $1 - f_{\text{coh}}$.
---
### Detailed Analysis
#### Sub-plot (a) [Top-Left]
* **Trend:** The data points follow an upward, slightly convex curve. The error bars increase in magnitude as $n$ increases.
* **Data Points (Approximate):**
* $n=1$: $g^{(1)}(0) \approx 1.00$
* $n=2$: $g^{(2)}(0) \approx 1.01$
* $n=3$: $g^{(3)}(0) \approx 1.03$
* $n=4$: $g^{(4)}(0) \approx 1.05$
* $n=5$: $g^{(5)}(0) \approx 1.08$
* $n=6$: $g^{(6)}(0) \approx 1.12$
#### Sub-plot (b) [Bottom-Left]
* **Trend:** The data points follow a steeper upward, convex curve compared to (a).
* **Data Points (Approximate):**
* $n=1$: $g^{(1)}(0) \approx 1.00$
* $n=2$: $g^{(2)}(0) \approx 1.07$
* $n=3$: $g^{(3)}(0) \approx 1.20$
* $n=4$: $g^{(4)}(0) \approx 1.42$
* $n=5$: $g^{(5)}(0) \approx 1.72$
* $n=6$: $g^{(6)}(0) \approx 2.12$
#### Sub-plot (c) [Top-Right]
* **Trend:** A sharp, narrow peak centered at $k/k_d = 0$. The density drops rapidly as $|k/k_d|$ increases, leveling off into a background floor.
* **Annotation:** The horizontal line representing $1 - f_{\text{coh}} = 0.004$ aligns with the background floor of the density distribution.
* **Shaded Region:** A light blue shaded area surrounds the main line, representing uncertainty or variance.
#### Sub-plot (d) [Bottom-Right]
* **Trend:** Similar to (c), a sharp peak at $k/k_d = 0$, but the background floor is significantly higher.
* **Annotation:** The horizontal line representing $1 - f_{\text{coh}} = 0.029$ aligns with the background floor.
* **Shaded Region:** A light grey shaded area surrounds the main line.
---
### Key Observations
1. **Interaction Strength Impact:** Increasing the interaction ratio $U/J$ from 5 to 20 significantly increases the values of the higher-order correlation functions $g^{(n)}(0)$.
2. **Coherence Fraction:** The coherence fraction $f_{\text{coh}}$ decreases as $U/J$ increases (from 0.9960 to 0.971).
3. **Incoherent Background:** The density plots (c and d) visually demonstrate the "incoherent" part of the system. The background floor level, marked by $1 - f_{\text{coh}}$, is higher for the $U/J = 20$ case (0.029) than for the $U/J = 5$ case (0.004).
### Interpretation
This data illustrates the transition of a quantum system from a highly coherent state to a more correlated/incoherent state as interaction strength ($U/J$) increases.
* **Correlation Functions:** In a perfectly coherent state (like a pure Bose-Einstein Condensate), $g^{(n)}(0) = 1$ for all $n$. The deviation from 1 in these plots quantifies the degree of "bunching" or correlation in the system. The fact that $g^{(n)}(0)$ grows faster with $n$ for $U/J=20$ indicates that stronger interactions lead to higher-order correlations and a departure from pure coherence.
* **Density Distributions:** The sharp peak at $k/k_d = 0$ represents the coherent condensate fraction. The broad, lower-intensity background represents the incoherent (thermal or depleted) fraction. The horizontal lines at $1 - f_{\text{coh}}$ confirm that the "floor" of the density distribution corresponds to the incoherent fraction of the total population.
* **Conclusion:** The system with $U/J=20$ is significantly more depleted than the system with $U/J=5$, as evidenced by both the higher $g^{(n)}(0)$ values and the higher incoherent background level in the density distribution.