\n
## Bar Chart: TransCoder-IR Dataset - Success Rate vs. Temperature
### Overview
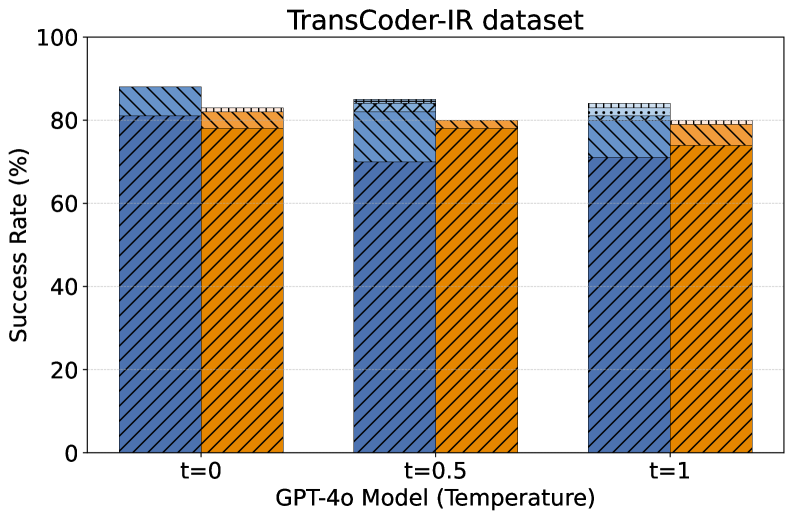
This bar chart visualizes the success rate of the GPT-4o model on the TransCoder-IR dataset, comparing performance across three different temperature settings (t=0, t=0.5, and t=1). Two data series are presented for each temperature: one representing a baseline or primary metric, and another representing a secondary metric. The chart uses paired bars to show the comparison.
### Components/Axes
* **Title:** "TransCoder-IR dataset" - positioned at the top-center of the chart.
* **X-axis:** "GPT-4o Model (Temperature)" - labeled with three temperature values: "t=0", "t=0.5", and "t=1". These are evenly spaced along the x-axis.
* **Y-axis:** "Success Rate (%)" - ranging from 0 to 100, with tick marks at intervals of 20.
* **Legend:** Implicitly defined by the bar colors. The blue bars represent one metric, and the orange bars represent another. The legend is not explicitly labeled, but the color association is consistent throughout the chart.
### Detailed Analysis
The chart consists of three groups of paired bars, one for each temperature setting.
* **t=0:**
* Blue Bar: The blue bar at t=0 reaches approximately 88% success rate.
* Orange Bar: The orange bar at t=0 reaches approximately 82% success rate.
* **t=0.5:**
* Blue Bar: The blue bar at t=0.5 reaches approximately 84% success rate.
* Orange Bar: The orange bar at t=0.5 reaches approximately 79% success rate.
* **t=1:**
* Blue Bar: The blue bar at t=1 reaches approximately 82% success rate.
* Orange Bar: The orange bar at t=1 reaches approximately 77% success rate.
The blue bars generally show a slight decreasing trend as the temperature increases, while the orange bars also show a similar decreasing trend.
### Key Observations
* The blue metric consistently outperforms the orange metric across all temperature settings.
* The highest success rate for both metrics is achieved at t=0.
* As the temperature increases, the success rate for both metrics decreases, although the decrease is relatively small.
* The difference in success rate between the blue and orange metrics remains relatively constant across all temperature settings, around 6-8%.
### Interpretation
The data suggests that the GPT-4o model performs best on the TransCoder-IR dataset at a temperature of 0. Increasing the temperature (introducing more randomness) leads to a slight decrease in performance for both the primary and secondary metrics being evaluated. The consistent outperformance of the blue metric indicates that it is a more robust or reliable measure of success for this task. The relatively small difference in performance across temperature settings suggests that the model is not highly sensitive to temperature variations within the tested range. This could be due to the nature of the TransCoder-IR dataset or the specific configuration of the GPT-4o model. Further investigation would be needed to understand the underlying reasons for these trends and to determine the optimal temperature setting for maximizing performance on this dataset.