## Composite Figure: Performance Chart, Logic Diagram, and 3D Surface Plot
### Overview
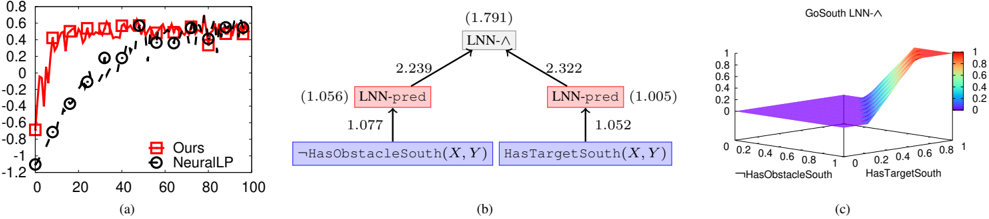
The image presents a composite figure consisting of three sub-figures labeled (a), (b), and (c). Sub-figure (a) is a line chart comparing the performance of two methods, "Ours" and "NeuralLP," over a range of iterations. Sub-figure (b) is a logic diagram illustrating the relationships between different logical components. Sub-figure (c) is a 3D surface plot visualizing the output of "GoSouth LNN-^" as a function of "HasObstacleSouth" and "HasTargetSouth."
### Components/Axes
**Sub-figure (a): Performance Chart**
* **Title:** Implicitly, a performance comparison chart.
* **X-axis:** Iterations, ranging from 0 to 100 in increments of 20.
* **Y-axis:** Performance metric, ranging from -1.2 to 0.8 in increments of 0.2.
* **Legend:** Located in the bottom-right corner.
* "Ours": Represented by a red line with square markers.
* "NeuralLP": Represented by a black dashed line with circle markers.
**Sub-figure (b): Logic Diagram**
* **Nodes:**
* Top: "LNN-^" (with a value of 1.791 in parentheses) - gray box
* Left: "LNN-pred" (with a value of 1.056 in parentheses) - red box
* Right: "LNN-pred" (with a value of 1.005 in parentheses) - red box
* Bottom-Left: "¬HasObstacleSouth(X, Y)" - blue box
* Bottom-Right: "HasTargetSouth(X, Y)" - blue box
* **Edges:** Arrows indicating logical relationships with associated numerical values.
* "¬HasObstacleSouth(X, Y)" to "LNN-pred": 1.077
* "HasTargetSouth(X, Y)" to "LNN-pred": 1.052
* "LNN-pred" (left) to "LNN-^": 2.239
* "LNN-pred" (right) to "LNN-^": 2.322
**Sub-figure (c): 3D Surface Plot**
* **Title:** "GoSouth LNN-^"
* **X-axis:** "¬HasObstacleSouth", ranging from 0 to 1.
* **Y-axis:** "HasTargetSouth", ranging from 0 to 1.
* **Z-axis:** Output value, ranging from 0 to 1, with a color gradient from blue (0) to red (1).
### Detailed Analysis
**Sub-figure (a): Performance Chart**
* **"Ours" (Red line with square markers):**
* Starts at approximately -0.7 at iteration 0.
* Increases sharply to approximately 0.4 by iteration 10.
* Fluctuates around 0.5-0.6 for the remaining iterations.
* **"NeuralLP" (Black dashed line with circle markers):**
* Starts at approximately -1.1 at iteration 0.
* Increases steadily to approximately 0.4 by iteration 80.
* Appears to plateau around 0.4 for the remaining iterations.
**Sub-figure (b): Logic Diagram**
* The diagram illustrates a hierarchical logical structure.
* The bottom-level nodes, "¬HasObstacleSouth(X, Y)" and "HasTargetSouth(X, Y)", feed into "LNN-pred" nodes.
* The "LNN-pred" nodes then feed into the top-level "LNN-^" node.
* The numerical values associated with the edges likely represent weights or strengths of the logical connections.
**Sub-figure (c): 3D Surface Plot**
* The surface plot shows the output of "GoSouth LNN-^" as a function of two input variables.
* When both "¬HasObstacleSouth" and "HasTargetSouth" are low (near 0), the output is also low (near 0, blue).
* As "HasTargetSouth" increases (towards 1), the output rapidly increases (towards 1, red), especially when "¬HasObstacleSouth" is also high.
* The surface is relatively flat when "HasTargetSouth" is low, indicating that the output is not significantly affected by "¬HasObstacleSouth" in this region.
### Key Observations
* In sub-figure (a), the "Ours" method initially performs worse than "NeuralLP" but quickly surpasses it and maintains a higher performance level.
* In sub-figure (b), the weights associated with the connections between nodes vary, suggesting different levels of importance or influence.
* In sub-figure (c), the output of "GoSouth LNN-^" is highly sensitive to "HasTargetSouth" and less sensitive to "¬HasObstacleSouth" when "HasTargetSouth" is low.
### Interpretation
The composite figure presents a comparison of two methods ("Ours" and "NeuralLP") in terms of performance, along with a logical representation of a system ("GoSouth LNN-^"). The performance chart suggests that the "Ours" method is superior to "NeuralLP" in this context. The logic diagram provides insight into the structure and relationships between different components of the "GoSouth LNN-^" system. The 3D surface plot visualizes the behavior of the "GoSouth LNN-^" system, demonstrating how its output is influenced by the input variables "¬HasObstacleSouth" and "HasTargetSouth." The data suggests that the presence of a target to the south ("HasTargetSouth") is a critical factor in determining the output of the system, while the absence of an obstacle to the south ("¬HasObstacleSouth") has a less significant impact when there is no target.