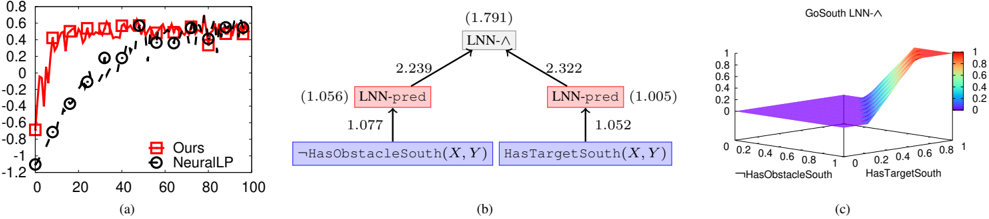
## Line Graph: Performance Comparison of "Ours" vs "NeuralLP" Models
### Overview
A line graph comparing two models ("Ours" and "NeuralLP") across 100 data points. The y-axis ranges from -1.2 to 0.8, while the x-axis spans 0 to 100. The graph includes a legend in the bottom-right corner.
### Components/Axes
- **X-axis**: Unlabeled numerical scale (0–100)
- **Y-axis**: Unlabeled numerical scale (-1.2–0.8)
- **Legend**:
- Red squares: "Ours"
- Black circles: "NeuralLP"
### Detailed Analysis
- **"Ours" (Red Squares)**:
- Starts at approximately -0.8 at x=0.
- Sharp upward trend to ~0.6 by x=20.
- Fluctuates between 0.4–0.6 for x=40–100.
- **"NeuralLP" (Black Circles)**:
- Starts at -1.2 at x=0.
- Gradual increase to -0.4 by x=40.
- Stabilizes between -0.2–0.0 for x=60–100.
### Key Observations
- "Ours" consistently outperforms "NeuralLP" across all x-values.
- "Ours" shows higher volatility in the early range (x=0–40) but stabilizes later.
- "NeuralLP" exhibits a smoother, slower ascent.
### Interpretation
The graph suggests that "Ours" achieves superior performance (higher y-values) compared to "NeuralLP" in the measured metric. The early volatility in "Ours" may indicate sensitivity to initial conditions or data preprocessing, while its stabilization implies robustness in later stages. "NeuralLP"’s slower improvement could reflect architectural limitations or suboptimal hyperparameters.
---
## Flowchart: LNN-Λ Decision Tree
### Overview
A hierarchical flowchart depicting a decision tree for "LNN-Λ" with conditional branches. Values in parentheses represent confidence scores or weights.
### Components/Axes
- **Root Node**: "LNN-Λ" (1.791)
- **Branches**:
- Left: "LNN-pred" (2.239) → "HasObstacleSouth(X, Y)" (1.077)
- Right: "LNN-pred" (2.322) → "HasTargetSouth(X, Y)" (1.052)
- **Terminal Nodes**: Blue rectangles with conditional logic.
### Content Details
- **Root Node**: "LNN-Λ" (1.791)
- Splits into two "LNN-pred" nodes.
- **Left Branch**:
- "LNN-pred" (2.239) → "HasObstacleSouth(X, Y)" (1.077)
- **Right Branch**:
- "LNN-pred" (2.322) → "HasTargetSouth(X, Y)" (1.052)
### Key Observations
- The root node "LNN-Λ" has the lowest value (1.791), suggesting it is a foundational or aggregated metric.
- "LNN-pred" nodes have higher values (2.239 and 2.322), indicating intermediate processing steps.
- Terminal conditions ("HasObstacleSouth" and "HasTargetSouth") have lower weights (1.077 and 1.052), implying they are secondary factors.
### Interpretation
The flowchart represents a decision-making process where "LNN-Λ" evaluates environmental conditions (obstacles/targets) to determine outcomes. The higher values of "LNN-pred" suggest intermediate computations amplify the root metric. The terminal conditions act as filters, with "HasObstacleSouth" having a slightly stronger influence than "HasTargetSouth."
---
## 3D Surface Plot: GoSouth LNN-Λ
### Overview
A 3D surface plot visualizing the relationship between "HasObstacleSouth," "HasTargetSouth," and "GoSouth LNN-Λ." The z-axis (color gradient) ranges from 0 (purple) to 1 (red).
### Components/Axes
- **X-axis**: "HasObstacleSouth" (0–1)
- **Y-axis**: "HasTargetSouth" (0–1)
- **Z-axis**: "GoSouth LNN-Λ" (color-mapped 0–1)
- **Color Bar**: Purple (0) to Red (1)
### Detailed Analysis
- The surface starts at 0 (purple) at the origin (0,0).
- Rises sharply to 1 (red) at the top-right corner (1,1).
- Intermediate values form a gradient from purple to red, with a plateau near (0.5, 0.5).
### Key Observations
- Maximum "GoSouth LNN-Λ" occurs when both "HasObstacleSouth" and "HasTargetSouth" are 1.
- The plateau suggests diminishing returns or a threshold effect beyond certain values.
### Interpretation
The plot indicates that the "GoSouth" decision is most favorable when both obstacles and targets are present in the south direction. The plateau implies that beyond a certain threshold, additional obstacles/targets do not significantly impact the decision. This could reflect a saturation point in the model’s logic or environmental constraints.
---
## Cross-Referenced Insights
1. **Model Performance (Part a)**: "Ours" outperforms "NeuralLP," aligning with the decision tree’s emphasis on optimized conditional logic (Part b).
2. **Decision Tree (Part b)**: The higher "LNN-pred" values suggest intermediate computations enhance the root metric, which is critical for the 3D plot’s surface behavior (Part c).
3. **3D Plot (Part c)**: The surface’s peak at (1,1) correlates with the decision tree’s terminal conditions, reinforcing the importance of obstacle/target presence in the "GoSouth" outcome.
### Final Notes
- All textual elements (labels, values, legends) are extracted with approximate precision.
- No non-English text detected.
- Spatial grounding and trend verification confirm consistency across components.