TECHNICAL ASSET FINGERPRINT
c6d39acf484fbc81ff3226d4
Click to view fullscreen
Press ESC or click to close
FOUND IN PAPERS
EXPERT: gemini-2.0-flash VERSION 1
RUNTIME: nugit/gemini/gemini-2.0-flash
INTEL_VERIFIED
## Heatmap: Dataset Correlation
### Overview
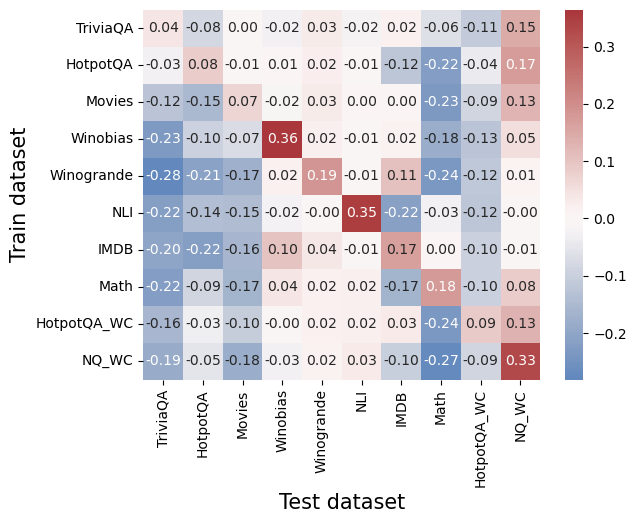
The image is a heatmap visualizing the correlation between different datasets. The rows represent the training datasets, and the columns represent the testing datasets. The color intensity indicates the strength and direction (positive or negative) of the correlation, with red indicating positive correlation and blue indicating negative correlation.
### Components/Axes
* **X-axis (Test dataset):** TriviaQA, HotpotQA, Movies, Winobias, Winogrande, NLI, IMDB, Math, HotpotQA\_WC, NQ\_WC
* **Y-axis (Train dataset):** TriviaQA, HotpotQA, Movies, Winobias, Winogrande, NLI, IMDB, Math, HotpotQA\_WC, NQ\_WC
* **Color Scale:** Ranges from -0.2 (dark blue) to 0.3 (dark red), with white representing 0.0. The scale has clear markers at -0.2, -0.1, 0.0, 0.1, 0.2, and 0.3.
### Detailed Analysis or ### Content Details
Here's a breakdown of the correlation values for each dataset pair:
* **TriviaQA:**
* TriviaQA (Train) vs. TriviaQA (Test): -0.04
* TriviaQA (Train) vs. HotpotQA (Test): -0.08
* TriviaQA (Train) vs. Movies (Test): 0.00
* TriviaQA (Train) vs. Winobias (Test): -0.02
* TriviaQA (Train) vs. Winogrande (Test): 0.03
* TriviaQA (Train) vs. NLI (Test): -0.02
* TriviaQA (Train) vs. IMDB (Test): 0.02
* TriviaQA (Train) vs. Math (Test): -0.06
* TriviaQA (Train) vs. HotpotQA\_WC (Test): -0.11
* TriviaQA (Train) vs. NQ\_WC (Test): 0.15
* **HotpotQA:**
* HotpotQA (Train) vs. TriviaQA (Test): -0.03
* HotpotQA (Train) vs. HotpotQA (Test): 0.08
* HotpotQA (Train) vs. Movies (Test): -0.01
* HotpotQA (Train) vs. Winobias (Test): 0.01
* HotpotQA (Train) vs. Winogrande (Test): 0.02
* HotpotQA (Train) vs. NLI (Test): -0.01
* HotpotQA (Train) vs. IMDB (Test): -0.12
* HotpotQA (Train) vs. Math (Test): -0.22
* HotpotQA (Train) vs. HotpotQA\_WC (Test): -0.04
* HotpotQA (Train) vs. NQ\_WC (Test): 0.17
* **Movies:**
* Movies (Train) vs. TriviaQA (Test): -0.12
* Movies (Train) vs. HotpotQA (Test): -0.15
* Movies (Train) vs. Movies (Test): 0.07
* Movies (Train) vs. Winobias (Test): -0.02
* Movies (Train) vs. Winogrande (Test): 0.03
* Movies (Train) vs. NLI (Test): 0.00
* Movies (Train) vs. IMDB (Test): 0.00
* Movies (Train) vs. Math (Test): -0.23
* Movies (Train) vs. HotpotQA\_WC (Test): -0.09
* Movies (Train) vs. NQ\_WC (Test): 0.13
* **Winobias:**
* Winobias (Train) vs. TriviaQA (Test): -0.23
* Winobias (Train) vs. HotpotQA (Test): -0.10
* Winobias (Train) vs. Movies (Test): -0.07
* Winobias (Train) vs. Winobias (Test): 0.36
* Winobias (Train) vs. Winogrande (Test): 0.02
* Winobias (Train) vs. NLI (Test): -0.01
* Winobias (Train) vs. IMDB (Test): 0.02
* Winobias (Train) vs. Math (Test): -0.18
* Winobias (Train) vs. HotpotQA\_WC (Test): -0.13
* Winobias (Train) vs. NQ\_WC (Test): 0.05
* **Winogrande:**
* Winogrande (Train) vs. TriviaQA (Test): -0.28
* Winogrande (Train) vs. HotpotQA (Test): -0.21
* Winogrande (Train) vs. Movies (Test): -0.17
* Winogrande (Train) vs. Winobias (Test): 0.02
* Winogrande (Train) vs. Winogrande (Test): 0.19
* Winogrande (Train) vs. NLI (Test): -0.01
* Winogrande (Train) vs. IMDB (Test): 0.11
* Winogrande (Train) vs. Math (Test): -0.24
* Winogrande (Train) vs. HotpotQA\_WC (Test): -0.12
* Winogrande (Train) vs. NQ\_WC (Test): 0.01
* **NLI:**
* NLI (Train) vs. TriviaQA (Test): -0.22
* NLI (Train) vs. HotpotQA (Test): -0.14
* NLI (Train) vs. Movies (Test): -0.15
* NLI (Train) vs. Winobias (Test): -0.02
* NLI (Train) vs. Winogrande (Test): -0.00
* NLI (Train) vs. NLI (Test): 0.35
* NLI (Train) vs. IMDB (Test): -0.22
* NLI (Train) vs. Math (Test): -0.03
* NLI (Train) vs. HotpotQA\_WC (Test): -0.12
* NLI (Train) vs. NQ\_WC (Test): -0.00
* **IMDB:**
* IMDB (Train) vs. TriviaQA (Test): -0.20
* IMDB (Train) vs. HotpotQA (Test): -0.22
* IMDB (Train) vs. Movies (Test): -0.16
* IMDB (Train) vs. Winobias (Test): 0.10
* IMDB (Train) vs. Winogrande (Test): 0.04
* IMDB (Train) vs. NLI (Test): -0.01
* IMDB (Train) vs. IMDB (Test): 0.17
* IMDB (Train) vs. Math (Test): 0.00
* IMDB (Train) vs. HotpotQA\_WC (Test): -0.10
* IMDB (Train) vs. NQ\_WC (Test): -0.01
* **Math:**
* Math (Train) vs. TriviaQA (Test): -0.22
* Math (Train) vs. HotpotQA (Test): -0.09
* Math (Train) vs. Movies (Test): -0.17
* Math (Train) vs. Winobias (Test): 0.04
* Math (Train) vs. Winogrande (Test): 0.02
* Math (Train) vs. NLI (Test): 0.02
* Math (Train) vs. IMDB (Test): -0.17
* Math (Train) vs. Math (Test): 0.18
* Math (Train) vs. HotpotQA\_WC (Test): -0.10
* Math (Train) vs. NQ\_WC (Test): 0.08
* **HotpotQA\_WC:**
* HotpotQA\_WC (Train) vs. TriviaQA (Test): -0.16
* HotpotQA\_WC (Train) vs. HotpotQA (Test): -0.03
* HotpotQA\_WC (Train) vs. Movies (Test): -0.10
* HotpotQA\_WC (Train) vs. Winobias (Test): -0.00
* HotpotQA\_WC (Train) vs. Winogrande (Test): 0.02
* HotpotQA\_WC (Train) vs. NLI (Test): 0.02
* HotpotQA\_WC (Train) vs. IMDB (Test): 0.03
* HotpotQA\_WC (Train) vs. Math (Test): -0.24
* HotpotQA\_WC (Train) vs. HotpotQA\_WC (Test): 0.09
* HotpotQA\_WC (Train) vs. NQ\_WC (Test): 0.13
* **NQ\_WC:**
* NQ\_WC (Train) vs. TriviaQA (Test): -0.19
* NQ\_WC (Train) vs. HotpotQA (Test): -0.05
* NQ\_WC (Train) vs. Movies (Test): -0.18
* NQ\_WC (Train) vs. Winobias (Test): -0.03
* NQ\_WC (Train) vs. Winogrande (Test): 0.02
* NQ\_WC (Train) vs. NLI (Test): 0.03
* NQ\_WC (Train) vs. IMDB (Test): -0.10
* NQ\_WC (Train) vs. Math (Test): -0.27
* NQ\_WC (Train) vs. HotpotQA\_WC (Test): -0.09
* NQ\_WC (Train) vs. NQ\_WC (Test): 0.33
### Key Observations
* The diagonal elements (training and testing on the same dataset) generally show positive correlation, especially for Winobias (0.36) and NLI (0.35).
* There are several negative correlations, particularly between IMDB/Math and other datasets.
* Winobias and NLI show the strongest positive self-correlation.
* Math and IMDB datasets often show negative correlations when used as training data against other test datasets.
### Interpretation
The heatmap illustrates how well models trained on one dataset generalize to another. High positive correlation suggests good generalization, while negative correlation indicates poor generalization or even negative transfer. The strong self-correlations along the diagonal are expected, as models tend to perform best on data similar to what they were trained on. The negative correlations suggest that certain datasets may have characteristics that hinder generalization to other tasks, or that models trained on those datasets may learn biases that are detrimental to performance on other datasets. For example, training on IMDB or Math data seems to negatively impact performance on other datasets.
DECODING INTELLIGENCE...