\n
## Heatmap: Correlation Matrix of Dataset Performance
### Overview
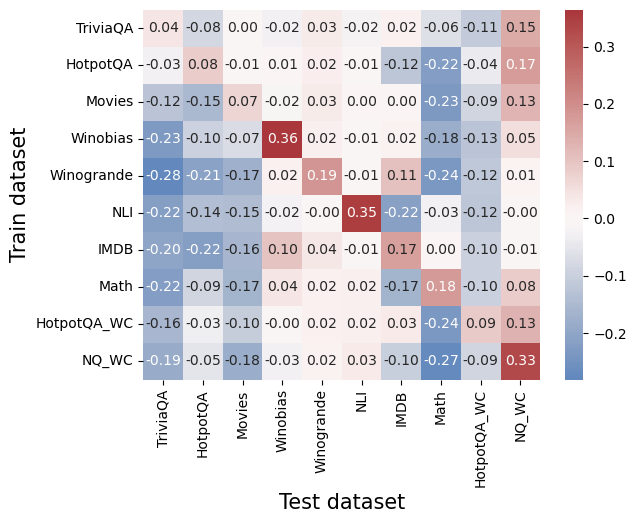
The image presents a heatmap visualizing the correlation matrix between different datasets used for training and testing. The color intensity represents the correlation coefficient, ranging from -0.3 to 0.3. The heatmap displays the correlation between each pair of datasets, indicating how well performance on one dataset predicts performance on another.
### Components/Axes
* **X-axis:** "Test dataset" - Lists the datasets used for testing: TriviaQA, HotpotQA, Movies, Winobias, Winogrande, NLI, IMDB, Math, HotpotQA\_WC, and NQ\_WC.
* **Y-axis:** "Train dataset" - Lists the datasets used for training: TriviaQA, HotpotQA, Movies, Winobias, Winogrande, NLI, IMDB, Math, HotpotQA\_WC, and NQ\_WC.
* **Color Scale:** A continuous color scale ranging from blue to red. Blue represents negative correlation, white represents zero correlation, and red represents positive correlation. The scale is labeled from -0.3 to 0.3.
* **Data Values:** Numerical values are displayed within each cell of the heatmap, representing the correlation coefficient between the corresponding train and test datasets.
### Detailed Analysis
The heatmap shows a variety of correlation coefficients. Here's a breakdown of some key observations, referencing the color and approximate values:
* **TriviaQA:**
* TriviaQA (Train) vs. TriviaQA (Test): 0.15 (Light Red) - Moderate positive correlation.
* TriviaQA (Train) vs. HotpotQA (Test): -0.08 (Light Blue) - Slight negative correlation.
* TriviaQA (Train) vs. Movies (Test): 0.04 (Near White) - Very weak correlation.
* **HotpotQA:**
* HotpotQA (Train) vs. HotpotQA (Test): 0.17 (Light Red) - Moderate positive correlation.
* HotpotQA (Train) vs. Movies (Test): -0.01 (Near White) - Very weak correlation.
* HotpotQA (Train) vs. Winobias (Test): 0.01 (Near White) - Very weak correlation.
* **Movies:**
* Movies (Train) vs. Movies (Test): 0.13 (Light Red) - Moderate positive correlation.
* Movies (Train) vs. Winobias (Test): -0.07 (Light Blue) - Slight negative correlation.
* Movies (Train) vs. Winogrande (Test): -0.17 (Light Blue) - Slight negative correlation.
* **Winobias:**
* Winobias (Train) vs. Winobias (Test): 0.36 (Dark Red) - Strong positive correlation.
* Winobias (Train) vs. Winogrande (Test): 0.19 (Light Red) - Moderate positive correlation.
* **Winogrande:**
* Winogrande (Train) vs. Winogrande (Test): 0.01 (Near White) - Very weak correlation.
* Winogrande (Train) vs. NLI (Test): -0.01 (Near White) - Very weak correlation.
* **NLI:**
* NLI (Train) vs. NLI (Test): 0.35 (Dark Red) - Strong positive correlation.
* **IMDB:**
* IMDB (Train) vs. IMDB (Test): -0.01 (Near White) - Very weak correlation.
* **Math:**
* Math (Train) vs. Math (Test): 0.08 (Light Red) - Slight positive correlation.
* **HotpotQA\_WC:**
* HotpotQA\_WC (Train) vs. HotpotQA\_WC (Test): 0.09 (Light Red) - Slight positive correlation.
* **NQ\_WC:**
* NQ\_WC (Train) vs. NQ\_WC (Test): 0.33 (Dark Red) - Strong positive correlation.
Generally, the diagonal elements (where train and test datasets are the same) show the strongest positive correlations, as expected.
### Key Observations
* **Strongest Positive Correlations:** Winobias (0.36), NLI (0.35), and NQ\_WC (0.33) exhibit the strongest positive correlations with themselves.
* **Negative Correlations:** Several pairs show slight negative correlations (values between -0.1 and -0.2), indicating that performance on one dataset might be weakly predictive of *lower* performance on the other.
* **Weak Correlations:** Many pairs have correlation coefficients close to zero, suggesting little to no relationship between performance on those datasets.
### Interpretation
This heatmap provides insights into the transferability of performance between different datasets. The strong positive correlations along the diagonal suggest that a model trained and tested on the same dataset will generally perform consistently. The weak correlations between many dataset pairs indicate that performance on one dataset is not a strong predictor of performance on another. This could be due to differences in the nature of the questions, the domain of knowledge required, or the types of reasoning skills needed.
The negative correlations, while weak, suggest that improving performance on one dataset might sometimes come at the cost of performance on another. This could be due to overfitting to the specific characteristics of one dataset, leading to poorer generalization on others.
The data suggests that these datasets, while all related to question answering, represent distinct challenges. A model that excels on Winobias or NLI might not necessarily perform well on TriviaQA or Movies, and vice versa. This highlights the importance of evaluating models on a diverse set of datasets to get a comprehensive understanding of their capabilities. The "WC" datasets (HotpotQA\_WC and NQ\_WC) appear to have relatively low correlations with other datasets, suggesting they may represent different types of question answering tasks or require different skills.