## Heatmap: Cross-Dataset Performance Correlation
### Overview
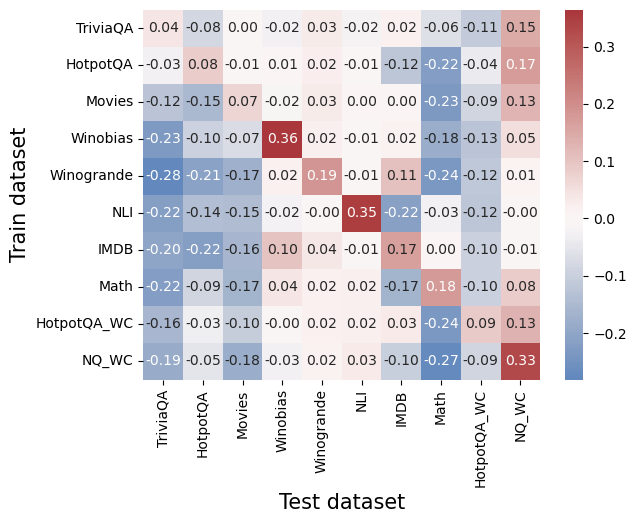
This heatmap visualizes the correlation between performance metrics of different question-answering datasets when used as training and test sets. Values range from -0.2 (blue) to +0.3 (red), indicating negative to positive correlations.
### Components/Axes
- **X-axis (Test datasets)**: TriviaQA, HotpotQA, Movies, Winobias, Winogrande, NLI, IMDB, Math, HotpotQA_WC, NQ_WC
- **Y-axis (Train datasets)**: Same list as X-axis
- **Color legend**:
- Red → Positive correlation (0.1–0.3)
- Blue → Negative correlation (-0.2–-0.0)
- White → Near-zero correlation (-0.01–0.01)
### Detailed Analysis
1. **Diagonal dominance**:
- Highest positive values along the diagonal (e.g., Winobias: 0.36, NLI: 0.35, NQ_WC: 0.33)
- Indicates strongest correlation when train/test datasets match
2. **Negative correlations**:
- Winogrande vs NLI: -0.28 (strongest negative)
- Math vs Winobias: -0.18
- HotpotQA vs Movies: -0.15
3. **Notable off-diagonal positives**:
- TriviaQA vs NQ_WC: +0.15
- HotpotQA vs NQ_WC: +0.17
- IMDB vs Winobias: +0.17
4. **Color consistency**:
- All red cells (>0.1) match legend expectations
- Blue cells (<-0.1) align with negative correlation range
### Key Observations
- **Dataset specificity**: Diagonal values suggest models trained on a dataset perform best on the same dataset
- **Cross-dataset challenges**: Many negative correlations (e.g., Winogrande vs NLI) indicate poor generalization
- **Unexpected positives**: Some dissimilar datasets show positive correlations (e.g., TriviaQA ↔ NQ_WC)
- **Magnitude patterns**: Largest absolute values cluster around diagonal and lower-left quadrant
### Interpretation
This heatmap reveals critical insights about dataset interoperability:
1. **Specialization vs generalization**: High diagonal values suggest models are highly specialized to their training data, with limited transferability
2. **Dataset relationships**: Negative correlations (e.g., Winogrande ↔ NLI) may indicate conflicting knowledge structures
3. **Unexpected synergies**: Positive off-diagonal values (e.g., TriviaQA ↔ NQ_WC) suggest some datasets share latent features
4. **Quantitative thresholds**: Values above 0.2 (red) and below -0.2 (blue) represent strong correlations worth investigating
The data implies that dataset choice significantly impacts model performance, with both strong specialization effects and surprising cross-dataset relationships. Further analysis could explore why certain dataset pairs show positive correlations despite surface differences.