## Bar Chart: Area Efficiency by Layer Group and IFM Shape
### Overview
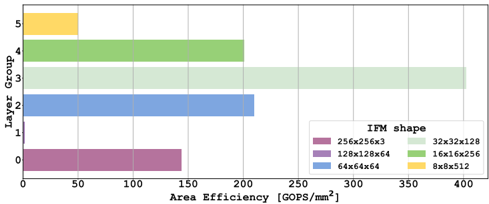
The image is a horizontal bar chart comparing the area efficiency (GOPS/mm²) of different layer groups (0-5) based on their IFM (Input Feature Map) shape. The chart displays the area efficiency for various IFM shapes within each layer group.
### Components/Axes
* **Y-axis (Vertical):** "Layer Group" with labels 0, 1, 2, 3, 4, and 5.
* **X-axis (Horizontal):** "Area Efficiency [GOPS/mm²]" with a scale from 0 to 400, incrementing by 50.
* **Legend (Bottom-Right):** "IFM shape" with the following shapes and corresponding colors:
* 256x256x3 (Purple)
* 128x128x64 (Blue)
* 64x64x64 (Dark Blue) - Not explicitly present in the chart, but inferred from the legend.
* 32x32x128 (Light Green)
* 16x16x256 (Green)
* 8x8x512 (Yellow)
### Detailed Analysis
Here's a breakdown of the area efficiency for each layer group and IFM shape:
* **Layer Group 0:**
* 256x256x3 (Purple): Area efficiency is approximately 140 GOPS/mm².
* **Layer Group 1:**
* 128x128x64 (Blue): Area efficiency is approximately 210 GOPS/mm².
* **Layer Group 2:** No data is present for this layer group.
* **Layer Group 3:**
* 32x32x128 (Light Green): Area efficiency is approximately 400 GOPS/mm².
* **Layer Group 4:**
* 16x16x256 (Green): Area efficiency is approximately 200 GOPS/mm².
* **Layer Group 5:**
* 8x8x512 (Yellow): Area efficiency is approximately 60 GOPS/mm².
### Key Observations
* Layer Group 3, with an IFM shape of 32x32x128, has the highest area efficiency, reaching approximately 400 GOPS/mm².
* Layer Group 5, with an IFM shape of 8x8x512, has the lowest area efficiency, at approximately 60 GOPS/mm².
* Layer Groups 2 has no data.
* The IFM shape 256x256x3 (Purple) is only present in Layer Group 0.
* The IFM shape 128x128x64 (Blue) is only present in Layer Group 1.
* The IFM shape 32x32x128 (Light Green) is only present in Layer Group 3.
* The IFM shape 16x16x256 (Green) is only present in Layer Group 4.
* The IFM shape 8x8x512 (Yellow) is only present in Layer Group 5.
### Interpretation
The chart illustrates how the area efficiency of a system varies depending on the layer group and the IFM shape used. The data suggests that the IFM shape significantly impacts area efficiency. The 32x32x128 IFM shape in Layer Group 3 is the most efficient, while the 8x8x512 IFM shape in Layer Group 5 is the least efficient. The absence of data for Layer Group 2 suggests that either no measurements were taken for that group or that the area efficiency was negligible. The chart highlights the importance of selecting appropriate IFM shapes for different layer groups to optimize area efficiency.