## Bar Chart: Area Efficiency by Layer Group and IFM Shape
### Overview
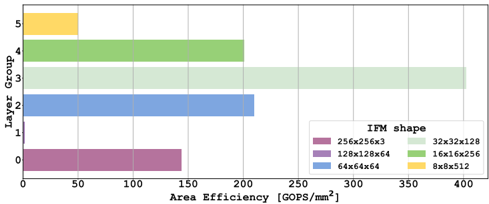
The chart compares area efficiency (measured in GOPS/mm²) across five Layer Groups (0–5) for six different IFM (Input Feature Map) shapes. Each Layer Group contains multiple colored bars representing distinct IFM configurations, with efficiency values ranging from ~0 to ~400 GOPS/mm².
### Components/Axes
- **Y-Axis (Layer Group)**: Discrete categories labeled 0 to 5, positioned vertically on the left.
- **X-Axis (Area Efficiency)**: Continuous scale from 0 to 400 GOPS/mm², with gridlines at 50-unit intervals.
- **Legend**: Located at the bottom-right, mapping six IFM shapes to colors:
- **Purple**: 256x256x3 (Layer 0), 128x128x64 (Layer 1)
- **Light Green**: 32x32x128 (Layer 3)
- **Blue**: 64x64x64 (Layer 2)
- **Green**: 16x16x256 (Layer 4)
- **Yellow**: 8x8x512 (Layer 5)
- **Dark Purple**: 128x128x64 (Layer 1, overlapping with purple)
### Detailed Analysis
1. **Layer 0**:
- Single dark purple bar (256x256x3) at ~150 GOPS/mm².
2. **Layer 1**:
- Two overlapping purple bars:
- 128x128x64 (~0 GOPS/mm², nearly invisible)
- 256x256x3 (~150 GOPS/mm², same as Layer 0).
3. **Layer 2**:
- Single blue bar (64x64x64) at ~210 GOPS/mm².
4. **Layer 3**:
- Single light green bar (32x32x128) spanning the full width (~400 GOPS/mm²).
5. **Layer 4**:
- Single green bar (16x16x256) at ~200 GOPS/mm².
6. **Layer 5**:
- Single yellow bar (8x8x512) at ~50 GOPS/mm².
### Key Observations
- **Layer 3** achieves the highest efficiency (~400 GOPS/mm²) with the 32x32x128 configuration.
- **Layer 5** has the lowest efficiency (~50 GOPS/mm²) with the 8x8x512 configuration.
- **Layer 1** shows conflicting data: two bars with the same dimensions (128x128x64) but vastly different efficiencies (0 vs. 150 GOPS/mm²), suggesting a potential error or mislabeling.
- **Layer 0 and 2** exhibit mid-range efficiencies (~150–210 GOPS/mm²) with larger IFM shapes (256x256x3 and 64x64x64).
### Interpretation
The chart demonstrates that area efficiency varies significantly across layers and IFM configurations. Larger spatial dimensions (e.g., 32x32x128 in Layer 3) correlate with higher efficiency, while smaller dimensions (e.g., 8x8x512 in Layer 5) result in lower efficiency. The anomaly in Layer 1—where identical dimensions (128x128x64) yield conflicting efficiencies—highlights a possible data inconsistency or misalignment in the legend. This suggests that efficiency is not solely determined by IFM size but may also depend on layer-specific optimizations or hardware constraints. The trend implies that balancing IFM dimensions with layer requirements is critical for maximizing computational efficiency.