## Chart: Proportion of Flips vs. Iterations for Qwen2.5-14B
### Overview
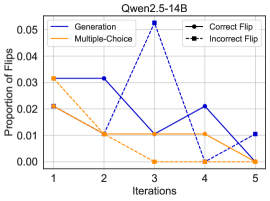
The image is a line chart comparing the proportion of flips (presumably in a model's output) across iterations for different methods: Generation, Multiple-Choice, Correct Flip, and Incorrect Flip. The x-axis represents iterations (1 to 5), and the y-axis represents the proportion of flips.
### Components/Axes
* **Title:** Qwen2.5-14B
* **X-axis:** Iterations (labeled 1, 2, 3, 4, 5)
* **Y-axis:** Proportion of Flips (labeled 0.00, 0.01, 0.02, 0.03, 0.04, 0.05)
* **Legend:** Located at the top-left and top-right of the chart.
* **Generation:** Solid blue line
* **Multiple-Choice:** Solid orange line
* **Correct Flip:** Dashed black line with square markers
* **Incorrect Flip:** Dashed black line
### Detailed Analysis
**1. Generation (Solid Blue Line):**
* Trend: Starts high, dips, spikes, then decreases.
* Data Points:
* Iteration 1: ~0.032
* Iteration 2: ~0.022
* Iteration 3: ~0.011
* Iteration 4: ~0.021
* Iteration 5: ~0.011
**2. Multiple-Choice (Solid Orange Line):**
* Trend: Decreases, plateaus, then decreases again.
* Data Points:
* Iteration 1: ~0.022
* Iteration 2: ~0.011
* Iteration 3: ~0.011
* Iteration 4: ~0.011
* Iteration 5: ~0.000
**3. Correct Flip (Dashed Black Line with Square Markers):**
* Trend: Decreases, spikes sharply, then decreases.
* Data Points:
* Iteration 1: ~0.032
* Iteration 2: ~0.011
* Iteration 3: ~0.053
* Iteration 4: ~0.000
* Iteration 5: ~0.011
**4. Incorrect Flip (Dashed Black Line):**
* Trend: Decreases to zero.
* Data Points:
* Iteration 1: ~0.032
* Iteration 2: ~0.000
* Iteration 3: ~0.000
* Iteration 4: ~0.000
* Iteration 5: ~0.000
### Key Observations
* The "Correct Flip" method shows a significant spike at iteration 3.
* The "Incorrect Flip" method goes to zero after iteration 1.
* The "Multiple-Choice" method has a relatively stable, low proportion of flips after iteration 2.
* The "Generation" method fluctuates more than the "Multiple-Choice" method.
### Interpretation
The chart illustrates how the proportion of flips changes across iterations for different methods in the Qwen2.5-14B model. The "Correct Flip" method's spike at iteration 3 suggests that this iteration might be crucial for correcting errors or improving the model's output. The "Incorrect Flip" method quickly diminishing to zero indicates that incorrect flips are effectively eliminated early in the process. The "Multiple-Choice" method's stability suggests a more consistent performance compared to the "Generation" method, which exhibits more variability. The data suggests that the "Correct Flip" method, while potentially effective, might also introduce instability or require careful management to avoid overcorrection.