\n
## Line Chart: Qwen2.5-14B - Proportion of Flips vs. Iterations
### Overview
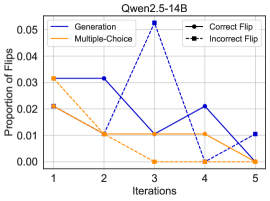
This line chart displays the proportion of flips observed across five iterations for two different methods: Generation and Multiple-Choice, along with the proportion of correct and incorrect flips. The chart aims to compare the behavior of these methods over successive iterations.
### Components/Axes
* **Title:** Qwen2.5-14B
* **X-axis:** Iterations (labeled 1 to 5)
* **Y-axis:** Proportion of Flips (scale from 0.00 to 0.05)
* **Legend:**
* Generation (Blue Solid Line)
* Multiple-Choice (Orange Solid Line)
* Correct Flip (Black Dashed Line)
* Incorrect Flip (Black Dotted Line)
* **Gridlines:** Present, providing a visual aid for reading values.
### Detailed Analysis
The chart contains four distinct lines representing the proportion of flips for each category.
* **Generation (Blue Solid Line):** This line exhibits a strong upward trend from Iteration 1 to Iteration 3, peaking at approximately 0.052. It then sharply declines to approximately 0.008 at Iteration 5.
* Iteration 1: ~0.015
* Iteration 2: ~0.032
* Iteration 3: ~0.052
* Iteration 4: ~0.022
* Iteration 5: ~0.008
* **Multiple-Choice (Orange Solid Line):** This line shows a decreasing trend from Iteration 1 to Iteration 5.
* Iteration 1: ~0.031
* Iteration 2: ~0.011
* Iteration 3: ~0.009
* Iteration 4: ~0.007
* Iteration 5: ~0.002
* **Correct Flip (Black Dashed Line):** This line fluctuates with a slight upward trend overall.
* Iteration 1: ~0.021
* Iteration 2: ~0.031
* Iteration 3: ~0.011
* Iteration 4: ~0.022
* Iteration 5: ~0.004
* **Incorrect Flip (Black Dotted Line):** This line generally decreases over the iterations.
* Iteration 1: ~0.004
* Iteration 2: ~0.003
* Iteration 3: ~0.001
* Iteration 4: ~0.001
* Iteration 5: ~0.0
### Key Observations
* The "Generation" method shows a significant increase in the proportion of flips up to Iteration 3, followed by a dramatic decrease.
* The "Multiple-Choice" method consistently exhibits a lower proportion of flips and a steady decline over the iterations.
* The "Correct Flip" line shows some fluctuation, but remains relatively stable.
* The "Incorrect Flip" line is consistently low and decreasing.
### Interpretation
The data suggests that the "Generation" method initially experiences a period of increased activity (flips) as it explores the solution space, reaching a peak at Iteration 3. The subsequent decline could indicate convergence or a stabilization of the generated outputs. The "Multiple-Choice" method, on the other hand, demonstrates a more consistent and decreasing trend, potentially indicating a faster convergence or a more constrained search process. The low and decreasing proportion of "Incorrect Flips" suggests that both methods are becoming more accurate over time. The difference in behavior between the two methods could be due to the inherent differences in their approaches to problem-solving. The "Generation" method might be more exploratory, while the "Multiple-Choice" method might be more focused on selecting the best option from a predefined set. The model "Qwen2.5-14B" appears to be improving with each iteration, as indicated by the decreasing proportion of incorrect flips.