\n
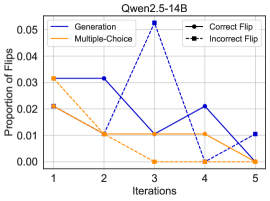
## Line Chart: Qwen2.5-14B - Proportion of Flips Over Iterations
### Overview
This is a line chart titled "Qwen2.5-14B" that plots the "Proportion of Flips" against "Iterations" for four different data series. The chart appears to track the performance or behavior of a model (likely the Qwen2.5-14B language model) across five discrete iterations, measuring the rate of "flips" (which could refer to changes in output, corrections, or errors) for different evaluation methods or categories.
### Components/Axes
- **Title:** "Qwen2.5-14B" (centered at the top).
- **Y-Axis:** Labeled "Proportion of Flips". The scale runs from 0.00 to 0.05, with major tick marks at intervals of 0.01 (0.00, 0.01, 0.02, 0.03, 0.04, 0.05).
- **X-Axis:** Labeled "Iterations". The scale shows discrete integer values from 1 to 5.
- **Legend:** Located in the top-right corner of the plot area. It defines four series:
1. **Generation:** Solid blue line.
2. **Multiple-Choice:** Dashed orange line.
3. **Correct Flip:** Solid black line with circular markers.
4. **Incorrect Flip:** Dashed black line with square markers.
- **Grid:** A light gray grid is present for both major x and y ticks.
### Detailed Analysis
The following data points are approximate values extracted by visual inspection of the chart.
**1. Generation (Solid Blue Line):**
- **Trend:** Starts high, dips significantly, recovers partially, then drops to zero.
- **Data Points:**
- Iteration 1: ~0.03
- Iteration 2: ~0.03
- Iteration 3: ~0.01
- Iteration 4: ~0.02
- Iteration 5: ~0.00
**2. Multiple-Choice (Dashed Orange Line):**
- **Trend:** Starts high, decreases, plateaus, then drops to zero.
- **Data Points:**
- Iteration 1: ~0.03
- Iteration 2: ~0.01
- Iteration 3: ~0.01
- Iteration 4: ~0.01
- Iteration 5: ~0.00
**3. Correct Flip (Solid Black Line, Circle Markers):**
- **Trend:** Shows a steady, monotonic decrease to zero.
- **Data Points:**
- Iteration 1: ~0.02
- Iteration 2: ~0.01
- Iteration 3: ~0.00
- Iteration 4: ~0.00
- Iteration 5: ~0.00
**4. Incorrect Flip (Dashed Black Line, Square Markers):**
- **Trend:** Starts moderate, dips, spikes dramatically to the chart's maximum, then falls sharply before a slight rise.
- **Data Points:**
- Iteration 1: ~0.02
- Iteration 2: ~0.01
- Iteration 3: ~0.05 (This is the highest point on the entire chart)
- Iteration 4: ~0.00
- Iteration 5: ~0.01
### Key Observations
1. **Peak Anomaly:** The most striking feature is the sharp spike in the "Incorrect Flip" series at Iteration 3, reaching the maximum y-axis value of 0.05. This is 5 times higher than its value at Iteration 2.
2. **Convergence to Zero:** Three of the four series ("Generation", "Multiple-Choice", "Correct Flip") converge to a proportion of 0.00 by Iteration 5. "Incorrect Flip" is the only series with a non-zero value at the final iteration.
3. **Initial Similarity:** At Iteration 1, the "Generation" and "Multiple-Choice" series start at the same point (~0.03), and the "Correct Flip" and "Incorrect Flip" series start at the same point (~0.02).
4. **Divergence at Iteration 3:** Iteration 3 is a critical point where all series show distinct behavior: "Incorrect Flip" peaks, "Generation" is at a local minimum, "Multiple-Choice" plateaus, and "Correct Flip" hits zero.
### Interpretation
The chart likely illustrates the dynamics of a model's self-correction or evaluation process over sequential iterations. The "Proportion of Flips" probably measures how often the model changes its initial answer or output.
- **What the data suggests:** The process appears to stabilize over time, as most flip proportions trend toward zero by the fifth iteration. However, the dramatic spike in "Incorrect Flip" at iteration 3 indicates a specific phase where the model becomes highly prone to making erroneous changes. This could be a point of over-correction or confusion in its reasoning process.
- **Relationship between elements:** The "Correct Flip" and "Incorrect Flip" series may be sub-categories of the flips measured in the "Generation" and "Multiple-Choice" tasks. The fact that "Correct Flip" steadily decreases to zero suggests the model stops making beneficial corrections early on. In contrast, the volatile "Incorrect Flip" series shows that harmful or erroneous corrections persist longer and exhibit unpredictable surges.
- **Notable anomaly:** The Iteration 3 spike for "Incorrect Flip" is the key finding. It suggests a non-linear, potentially problematic stage in the iterative process that warrants investigation. It might correlate with a specific type of task or a threshold in the model's confidence calibration.
- **Overall implication:** While the model's tendency to flip answers diminishes with more iterations (a sign of increasing stability), the presence of a late-stage spike in incorrect flips highlights a risk. Simply running more iterations does not guarantee improved accuracy; it may introduce new failure modes. The process requires careful monitoring, especially around the third iteration.