## Line Chart: Qwen2.5-14B Performance Analysis
### Overview
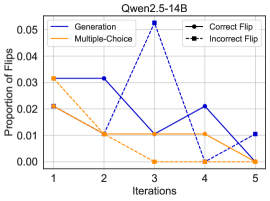
The chart illustrates the proportion of flips (correct and incorrect) for two methods—Generation and Multiple-Choice—across five iterations. It also includes markers for correct and incorrect flips, though their relationship to the lines is ambiguous. The y-axis represents the proportion of flips (0.00 to 0.05), and the x-axis represents iterations (1 to 5).
### Components/Axes
- **Title**: "Qwen2.5-14B"
- **Y-Axis**: "Proportion of Flips" (scale: 0.00 to 0.05)
- **X-Axis**: "Iterations" (1 to 5)
- **Legend**:
- **Generation**: Blue line
- **Multiple-Choice**: Orange line
- **Correct Flip**: Solid black marker
- **Incorrect Flip**: Dashed black marker
### Detailed Analysis
- **Generation (Blue Line)**:
- Iteration 1: ~0.03
- Iteration 2: ~0.03
- Iteration 3: ~0.05 (peak)
- Iteration 4: ~0.02
- Iteration 5: ~0.01
- **Multiple-Choice (Orange Line)**:
- Iteration 1: ~0.03
- Iteration 2: ~0.01
- Iteration 3: ~0.01
- Iteration 4: ~0.01
- Iteration 5: ~0.00
- **Correct Flip (Solid Black Markers)**:
- Iteration 1: ~0.03
- Iteration 2: ~0.01
- Iteration 3: ~0.00
- Iteration 4: ~0.00
- Iteration 5: ~0.00
- **Incorrect Flip (Dashed Black Markers)**:
- Iteration 1: ~0.02
- Iteration 2: ~0.02
- Iteration 3: ~0.01
- Iteration 4: ~0.01
- Iteration 5: ~0.00
### Key Observations
1. **Generation Method**:
- Peaks at iteration 3 (0.05) before declining sharply.
- Shows a U-shaped trend with a sharp drop after iteration 3.
2. **Multiple-Choice Method**:
- Starts at 0.03 (iteration 1) and declines steadily to 0.00 by iteration 5.
3. **Correct/Incorrect Flips**:
- Correct flips (solid black) decrease monotonically after iteration 1.
- Incorrect flips (dashed black) also decline but remain higher than correct flips in early iterations.
4. **Discrepancies**:
- The sum of correct and incorrect flips (e.g., 0.03 + 0.02 = 0.05 at iteration 1) exceeds the Generation line value (0.03), suggesting potential misalignment in data representation.
### Interpretation
- The chart highlights the performance of two methods (Generation and Multiple-Choice) in terms of flip proportions. The Generation method exhibits a sharp peak at iteration 3, possibly indicating a temporary anomaly or optimization point. The Multiple-Choice method shows a consistent decline, suggesting diminishing returns over iterations.
- The Correct and Incorrect Flip markers do not align with the lines, raising questions about their relationship. For example, the total flips (correct + incorrect) often exceed the line values, implying either overlapping data series or a misinterpretation of the legend. This could indicate a need for clarification in the data labeling or visualization design.
- The decline in both correct and incorrect flips after iteration 3 suggests that the model's performance stabilizes or deteriorates over time, depending on the context of "flips" (e.g., model corrections or errors).