# Technical Document Extraction: Cache Hit Rate Analysis
## Chart Type
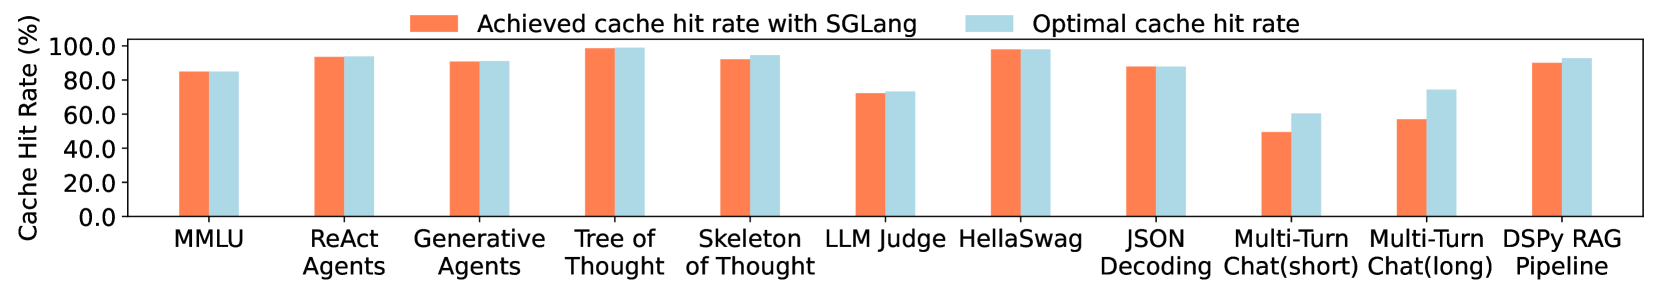
Bar chart comparing cache hit rates across different tasks/models.
## Axis Labels
- **X-axis**: Task/Model categories (categorical)
- **Y-axis**: "Cache Hit Rate (%)" (numerical, 0–100%)
## Legend
- **Orange**: "Achieved cache hit rate with SGLang"
- **Blue**: "Optimal cache hit rate"
## Categories (X-axis)
1. MMLU
2. ReAct Agents
3. Generative Agents
4. Tree of Thought
5. Skeleton of Thought
6. LLM Judge
7. HellaSwag
8. JSON Decoding
9. Multi-Turn Chat(short)
10. Multi-Turn Chat(long)
11. DSPy RAG Pipeline
## Key Trends
1. **Achieved vs. Optimal**:
- Orange bars (SGLang) consistently show **slightly lower** values than blue bars (optimal) across all categories.
- Largest gap observed in **Multi-Turn Chat(short)** (orange: ~50%, blue: ~60%).
- Smallest gap in **Tree of Thought** and **HellaSwag** (both near 100% for both metrics).
2. **Highest Achieved Rates**:
- **Tree of Thought** and **HellaSwag** achieve ~95–100% cache hit rate with SGLang.
- **JSON Decoding** and **DSPy RAG Pipeline** also show high performance (~85–90%).
3. **Lowest Achieved Rates**:
- **Multi-Turn Chat(short)** (orange: ~50%) and **Multi-Turn Chat(long)** (orange: ~60%) underperform significantly compared to optimal rates.
## Observations
- SGLang achieves **~5–10% lower** cache hit rates than optimal values in most categories.
- Tasks involving **multi-turn conversations** (short/long) exhibit the largest performance gaps.
- Structured tasks like **JSON Decoding** and **DSPy RAG Pipeline** maintain closer alignment with optimal rates.
## Data Extraction Notes
- Exact numerical values are not provided in the image; percentages are estimated based on bar heights relative to the Y-axis scale.
- All categories show a consistent pattern: achieved rates < optimal rates, with varying degrees of deviation.