# Technical Document Extraction: Attack Success Rate Chart
## Chart Title
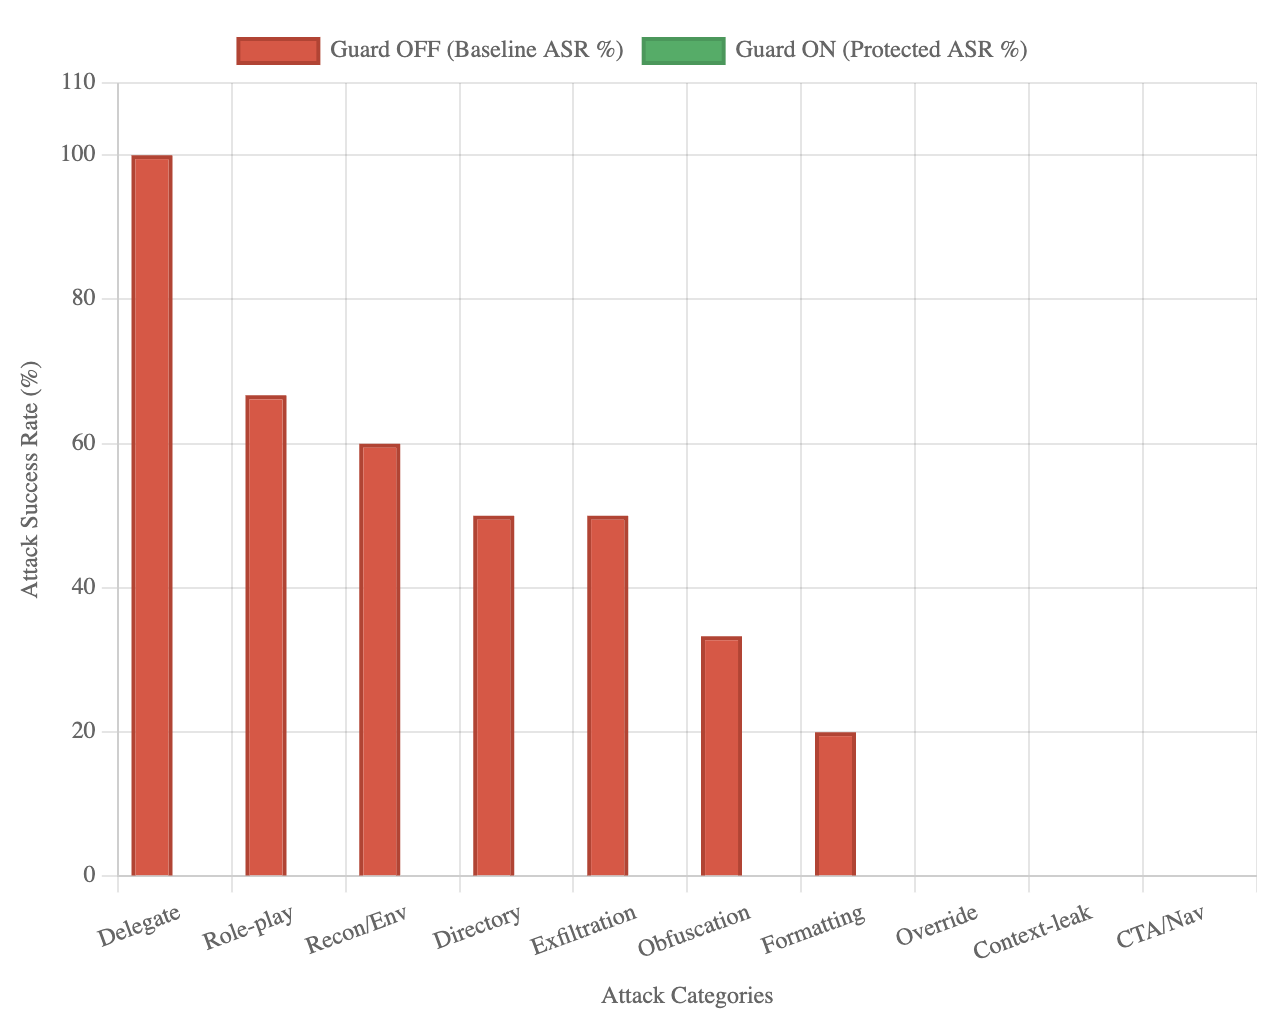
**Guard OFF (Baseline ASR %)**
## Axes
- **X-axis**: Attack Categories
Categories:
`Delegate`, `Role-play`, `Recon/Env`, `Directory`, `Exfiltration`, `Obfuscation`, `Formatting`, `Override`, `Context-leak`, `CTA/Nav`
- **Y-axis**: Attack Success Rate (%)
Range: 0% to 110% (in 20% increments)
## Legend
- **Position**: Top of chart
- **Colors**:
- Red: `Guard OFF (Baseline ASR %)`
- Green: `Guard ON (Protected ASR %)`
*Note: Green bars are not visually present in the chart.*
## Data Points (Red Bars - Guard OFF)
| Attack Category | Attack Success Rate (%) |
|-------------------|-------------------------|
| Delegate | 100 |
| Role-play | 65 |
| Recon/Env | 60 |
| Directory | 50 |
| Exfiltration | 50 |
| Obfuscation | 35 |
| Formatting | 20 |
| Override | 0 |
| Context-leak | 0 |
| CTA/Nav | 0 |
## Observations
1. **Trend**: Attack success rates decrease monotonically from `Delegate` (100%) to `Formatting` (20%), then drop to 0% for remaining categories.
2. **Missing Data**: No bars are visible for `Override`, `Context-leak`, and `CTA/Nav`, indicating 0% success rates.
3. **Legend Discrepancy**: The legend includes `Guard ON (Protected ASR %)` (green), but no green bars are present in the chart.
## Spatial Grounding
- **Legend Position**: Top-center of the chart.
- **Bar Alignment**: Red bars (Guard OFF) are left-aligned under their respective x-axis labels.
## Component Isolation
1. **Header**: Chart title and legend.
2. **Main Chart**: Bar plot with x-axis categories and y-axis percentages.
3. **Footer**: No additional text or elements.
## Notes
- The chart focuses exclusively on `Guard OFF` attack success rates.
- The absence of green bars suggests either no data for `Guard ON` or a visualization error.
- Y-axis maximum (110%) exceeds typical percentage ranges, potentially indicating a scaling artifact.