\n
## Multi-Panel Line Chart: Performance Comparison of Speculative Decoding Methods
### Overview
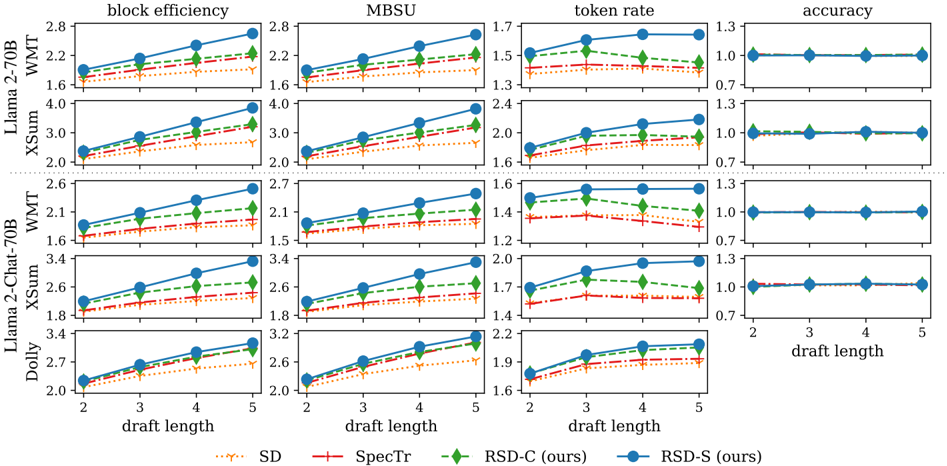
The image displays a 5x4 grid of line charts comparing the performance of four speculative decoding methods across five different model/dataset combinations. The charts measure four key metrics: block efficiency, MBSU (likely Mean Block Success Utilization), token rate, and accuracy. The x-axis for all charts is "draft length," ranging from 2 to 5. The y-axes have different scales for each metric.
### Components/Axes
* **Chart Grid Structure:**
* **Rows (Model/Dataset):** Llama 2-70B (WMT), Llama 2-70B (XSum), Llama 2-Chat-70B (WMT), Llama 2-Chat-70B (XSum), Dolly.
* **Columns (Metrics):** block efficiency, MBSU, token rate, accuracy.
* **X-Axis:** "draft length" with integer markers at 2, 3, 4, and 5.
* **Y-Axes:** Each column has its own scale. Approximate ranges are:
* **block efficiency:** ~1.6 to 4.0 (varies by row)
* **MBSU:** ~1.5 to 3.4 (varies by row)
* **token rate:** ~1.3 to 2.4 (varies by row)
* **accuracy:** Fixed scale from 0.7 to 1.3 for all rows.
* **Legend (Bottom Center):** Four methods are compared, each with a distinct color and marker:
* **SD:** Orange dotted line with downward-pointing triangle markers.
* **SpecTr:** Red dash-dot line with plus sign markers.
* **RSD-C (ours):** Green dashed line with diamond markers.
* **RSD-S (ours):** Blue solid line with circle markers.
### Detailed Analysis
**Row 1: Llama 2-70B (WMT)**
* **block efficiency:** All methods show a positive linear trend. RSD-S (blue) is highest (~2.0 at length 2, ~2.7 at length 5), followed by RSD-C (green), SpecTr (red), and SD (orange).
* **MBSU:** Similar positive trend. RSD-S leads (~1.9 to ~2.7), with the same order: RSD-S > RSD-C > SpecTr > SD.
* **token rate:** RSD-S shows a strong increase (~1.5 to ~1.65). RSD-C is relatively flat (~1.5). SpecTr and SD are lower and flat (~1.4).
* **accuracy:** All methods maintain a flat line at exactly 1.0 across all draft lengths.
**Row 2: Llama 2-70B (XSum)**
* **block efficiency:** Strong positive trends. RSD-S is highest (~2.3 to ~3.9). Order: RSD-S > RSD-C > SpecTr > SD.
* **MBSU:** Similar pattern. RSD-S leads (~2.2 to ~3.3).
* **token rate:** RSD-S increases (~1.8 to ~2.2). RSD-C is slightly lower and increases (~1.7 to ~2.0). SpecTr and SD are lower and increase slightly.
* **accuracy:** All methods maintain a flat line at 1.0.
**Row 3: Llama 2-Chat-70B (WMT)**
* **block efficiency:** Positive trends. RSD-S is highest (~1.8 to ~2.5). Order: RSD-S > RSD-C > SpecTr > SD.
* **MBSU:** RSD-S leads (~1.8 to ~2.6). RSD-C is close (~1.7 to ~2.3). SpecTr and SD are lower.
* **token rate:** RSD-S increases (~1.5 to ~1.6). RSD-C is slightly lower and peaks at length 3 (~1.55) before declining. SpecTr and SD are lower and relatively flat.
* **accuracy:** All methods maintain a flat line at 1.0.
**Row 4: Llama 2-Chat-70B (XSum)**
* **block efficiency:** Strong positive trends. RSD-S is highest (~2.3 to ~3.4). Order: RSD-S > RSD-C > SpecTr > SD.
* **MBSU:** RSD-S leads (~2.4 to ~3.4). RSD-C is close (~2.3 to ~2.9). SpecTr and SD are lower.
* **token rate:** RSD-S increases (~1.7 to ~2.0). RSD-C is slightly lower and increases (~1.7 to ~1.8). SpecTr and SD are lower and increase slightly.
* **accuracy:** All methods maintain a flat line at 1.0.
**Row 5: Dolly**
* **block efficiency:** Positive trends. RSD-S and RSD-C are very close and highest (~2.1 to ~3.1). SpecTr and SD are lower.
* **MBSU:** RSD-S and RSD-C are very close and highest (~2.4 to ~3.2). SpecTr and SD are lower.
* **token rate:** RSD-S and RSD-C are very close and increase (~1.8 to ~2.1). SpecTr and SD are lower and increase slightly.
* **accuracy:** **This row has no accuracy chart.** The fourth panel is empty.
### Key Observations
1. **Consistent Hierarchy:** In nearly all charts for block efficiency, MBSU, and token rate, the performance order is consistent: RSD-S (blue) ≥ RSD-C (green) > SpecTr (red) > SD (orange).
2. **Positive Scaling:** For block efficiency and MBSU, all methods show a clear positive linear relationship with draft length. Token rate shows a more modest or flat increase for most methods.
3. **Perfect Accuracy:** For the first four model/dataset combinations, all methods achieve a constant accuracy of 1.0 regardless of draft length, indicating no loss in generation quality.
4. **Dolly Exception:** The Dolly model row lacks an accuracy chart, and the performance gap between RSD-S and RSD-C is minimal compared to other models.
5. **Dataset Impact:** Models evaluated on the XSum dataset generally show higher absolute values for block efficiency and MBSU compared to the WMT dataset.
### Interpretation
This data demonstrates the effectiveness of the proposed methods, RSD-S and RSD-C, over the baselines (SD and SpecTr). The consistent superiority of RSD-S across metrics and models suggests it is the most effective speculative decoding strategy among those tested. The perfect accuracy scores indicate that these speed-up techniques do not compromise the quality of the generated text for the tested models and tasks. The positive scaling with draft length implies that longer drafts are utilized more efficiently by the better methods. The near-identical performance of RSD-S and RSD-C on the Dolly model, contrasted with their clearer separation on Llama models, may indicate model-specific characteristics that affect the relative advantage of one variant over the other. The absence of accuracy data for Dolly is a notable gap in the presented results.