## Line Chart: Performance Metrics Across Draft Lengths
### Overview
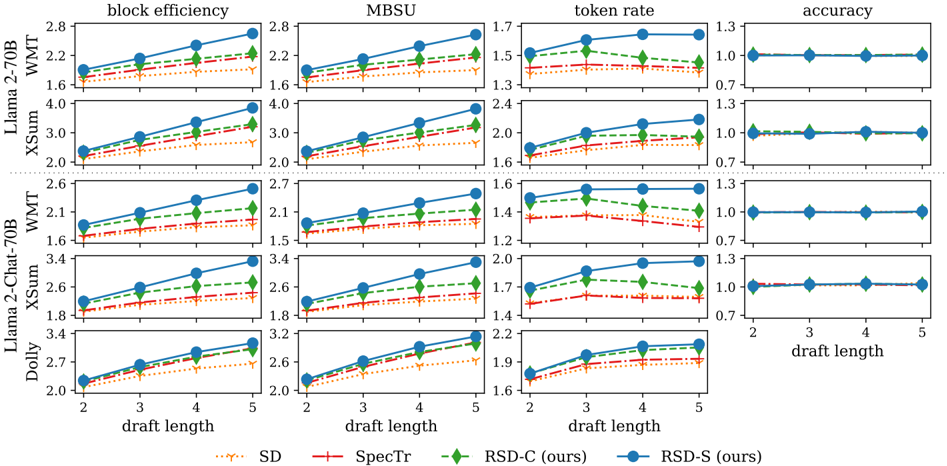
The image presents a multi-line chart comparing four performance metrics (block efficiency, MBSU, token rate, accuracy) across varying draft lengths (2–5). Four datasets are represented: SD (orange), SpecTr (red), RSD-C (green), and RSD-S (blue). Each metric is plotted in a separate subplot, with trends analyzed for increasing draft lengths.
### Components/Axes
- **X-axis**: Draft length (2–5), labeled "draft length" in all subplots.
- **Y-axes**:
- Block efficiency: 2.0–2.8
- MBSU: 2.0–4.0
- Token rate: 1.0–1.7
- Accuracy: 0.7–1.3
- **Legends**: Located at the bottom, with color-coded labels:
- Orange: SD
- Red: SpecTr
- Green: RSD-C (ours)
- Blue: RSD-S (ours)
### Detailed Analysis
#### Block Efficiency
- **Trend**: RSD-S (blue) increases steadily (2.0 → 2.8), RSD-C (green) remains flat (~2.2), SpecTr (red) shows slight growth (2.0 → 2.2), SD (orange) is flat (~2.0).
- **Data Points**:
- Draft 2: RSD-S 2.0, RSD-C 2.2, SpecTr 2.0, SD 2.0
- Draft 5: RSD-S 2.8, RSD-C 2.2, SpecTr 2.2, SD 2.0
#### MBSU
- **Trend**: RSD-S (blue) rises sharply (2.0 → 4.0), RSD-C (green) flat (~2.2), SpecTr (red) increases (2.0 → 3.0), SD (orange) flat (~2.0).
- **Data Points**:
- Draft 2: RSD-S 2.0, RSD-C 2.2, SpecTr 2.0, SD 2.0
- Draft 5: RSD-S 4.0, RSD-C 2.2, SpecTr 3.0, SD 2.0
#### Token Rate
- **Trend**: RSD-S (blue) increases (1.0 → 1.7), RSD-C (green) flat (~1.2), SpecTr (red) rises (1.0 → 1.4), SD (orange) flat (~1.0).
- **Data Points**:
- Draft 2: RSD-S 1.0, RSD-C 1.2, SpecTr 1.0, SD 1.0
- Draft 5: RSD-S 1.7, RSD-C 1.2, SpecTr 1.4, SD 1.0
#### Accuracy
- **Trend**: All lines remain flat at ~1.0, indicating no change across draft lengths.
### Key Observations
1. **RSD-S (blue)** consistently outperforms other datasets in block efficiency, MBSU, and token rate, with linear growth.
2. **RSD-C (green)** and **SD (orange)** show no improvement with longer drafts.
3. **SpecTr (red)** demonstrates moderate gains in block efficiency and MBSU but lags behind RSD-S.
4. **Accuracy** remains constant across all datasets and draft lengths.
### Interpretation
The data suggests that **RSD-S** is the most effective method for improving performance metrics as draft length increases, particularly in block efficiency and MBSU. **RSD-C** and **SD** exhibit no sensitivity to draft length, implying they may be less adaptive or optimized for this task. **SpecTr** shows partial improvement but underperforms compared to RSD-S. The flat accuracy across all metrics indicates that draft length does not impact the model's correctness, possibly due to normalization or inherent stability in the evaluation framework. This highlights the importance of draft length in optimizing efficiency and throughput but not in maintaining accuracy.