## Data Table: Function Call Timings
### Overview
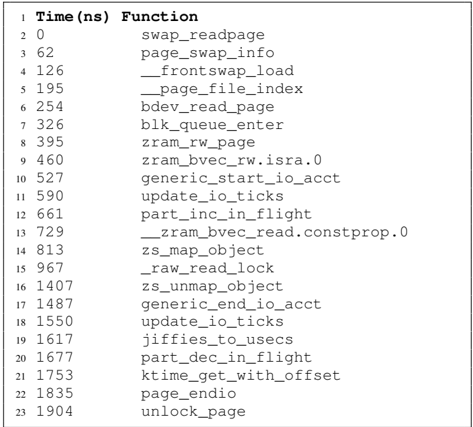
The image presents a data table listing function names and their corresponding execution times in nanoseconds (ns). The table appears to represent a sequence of function calls and their timings, potentially during a system operation or profiling session.
### Components/Axes
The table has two columns:
* **Time (ns)**: Represents the execution time of the function, measured in nanoseconds. The values are listed in ascending order.
* **Function**: Represents the name of the function being called.
The table is numbered from 1 to 23, indicating the sequence of function calls.
### Detailed Analysis / Content Details
Here's a reconstruction of the data table content:
| Row | Time (ns) | Function |
|-----|-----------|-----------------------|
| 1 | 0 | swap_readpage |
| 2 | 62 | page_swap_info |
| 3 | 126 | \_frontswap_load |
| 4 | 195 | \_page_file_index |
| 5 | 254 | bdev_read_page |
| 6 | 326 | blk_queue_enter |
| 7 | 395 | zram_rw_page |
| 8 | 460 | zram_bvec_rw.isra.0 |
| 9 | 527 | generic_start_io_acct |
| 10 | 590 | update_io_ticks |
| 11 | 661 | part_inc_in_flight |
| 12 | 729 | \_zram_bvec_read.constprop.0 |
| 13 | 813 | zs_map_object |
| 14 | 967 | \_raw_read_lock |
| 15 | 1407 | zs_unmap_object |
| 16 | 1487 | generic_end_io_acct |
| 17 | 1550 | update_io_ticks |
| 18 | 1617 | jiffies_to_usecs |
| 19 | 1677 | part_dec_in_flight |
| 20 | 1753 | ktime_get_with_offset|
| 21 | 1835 | page_endio |
| 22 | 1904 | unlock_page |
The time values increase monotonically, indicating a sequential execution of the functions. The time differences between consecutive function calls vary, suggesting differing execution complexities.
### Key Observations
* The function `update_io_ticks` appears twice in the list, at times 590 ns and 1550 ns.
* The largest time difference between consecutive function calls is between `\_raw_read_lock` (967 ns) and `zs_unmap_object` (1407 ns), indicating a potentially long-running operation or a significant delay.
* The initial function calls (`swap_readpage`, `page_swap_info`, etc.) have relatively small time differences, while later calls exhibit larger differences.
### Interpretation
This data likely represents a performance trace of a system operation involving page swapping, block device access, and memory management. The functions listed suggest operations related to virtual memory, disk I/O, and potentially compression (zram). The timings provide insights into the performance characteristics of these operations.
The repeated call to `update_io_ticks` suggests a periodic task related to I/O accounting. The large time difference before `zs_unmap_object` could indicate a blocking operation or a significant amount of processing within `\_raw_read_lock`.
Analyzing these timings could help identify performance bottlenecks and optimize the system for faster operation. The data could be used to understand the overhead associated with different system calls and to prioritize optimization efforts. The sequence of function calls also provides a high-level view of the system's activity during the traced period.