## Data Table: Function Call Timing Trace
### Overview
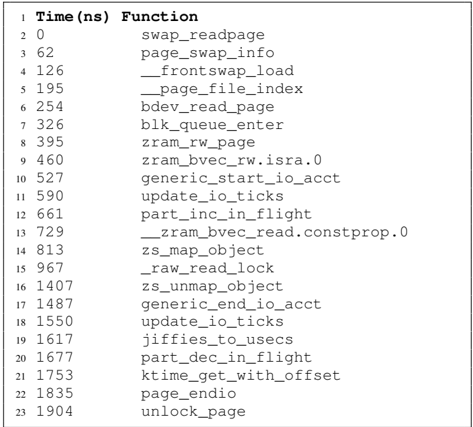
The image displays a two-column data table listing a sequence of function calls and their associated timestamps in nanoseconds (ns). This appears to be a trace log from a system profiling or debugging tool, capturing the execution flow of a low-level I/O or memory management operation, likely within an operating system kernel. The table is presented in a monospaced font, typical of terminal or log output.
### Components/Axes
* **Columns:**
1. **Time(ns):** The first column lists timestamps in nanoseconds. The values are integers, starting at 0 and increasing non-linearly.
2. **Function:** The second column lists the names of functions or routines being executed. The names follow a common kernel naming convention (e.g., using underscores, `.c` file references like `.isra.0`).
* **Layout:** The table has 23 data rows, each preceded by a line number (1-23) in a separate, unlabelled column on the far left. The text is left-aligned.
### Detailed Analysis
The following table reconstructs the complete content of the image. The "Line" column corresponds to the line numbers visible in the image.
| Line | Time(ns) | Function |
| :--- | :------- | :------- |
| 1 | 0 | swap_readpage |
| 2 | 62 | page_swap_info |
| 3 | 126 | __frontswap_load |
| 4 | 195 | __page_file_index |
| 5 | 254 | bdev_read_page |
| 6 | 326 | blk_queue_enter |
| 7 | 395 | zram_rw_page |
| 8 | 460 | zram_bvec_rw.isra.0 |
| 9 | 527 | generic_start_io_acct |
| 10 | 590 | update_io_ticks |
| 11 | 661 | part_inc_in_flight |
| 12 | 729 | __zram_bvec_read.constprop.0 |
| 13 | 813 | zs_map_object |
| 14 | 967 | _raw_read_lock |
| 15 | 1407 | zs_unmap_object |
| 16 | 1487 | generic_end_io_acct |
| 17 | 1550 | update_io_ticks |
| 18 | 1617 | jiffies_to_usecs |
| 19 | 1677 | part_dec_in_flight |
| 20 | 1753 | ktime_get_with_offset |
| 21 | 1835 | page_endio |
| 22 | 1904 | unlock_page |
### Key Observations
1. **Temporal Progression:** The `Time(ns)` values increase monotonically from 0 to 1904 ns, indicating this is a sequential trace of function calls during a single operation. The time between calls varies significantly (e.g., 62 ns between lines 1-2, 440 ns between lines 14-15).
2. **Function Sequence:** The trace begins with `swap_readpage` and ends with `unlock_page`, suggesting the operation is reading a page of data from a swap device or compressed memory (zram) and then releasing it.
3. **Key Subsystems:** The function names point to several kernel subsystems:
* **Swap/Frontswap:** `swap_readpage`, `__frontswap_load`
* **Block I/O:** `bdev_read_page`, `blk_queue_enter`
* **Compressed Memory (zram):** `zram_rw_page`, `zram_bvec_rw.isra.0`, `__zram_bvec_read.constprop.0`
* **Memory Management:** `zs_map_object`, `zs_unmap_object` (zsmalloc allocator)
* **I/O Accounting:** `generic_start_io_acct`, `generic_end_io_acct`, `update_io_ticks`, `part_inc_in_flight`, `part_dec_in_flight`
4. **Notable Latency:** The largest single time jump occurs between `_raw_read_lock` (967 ns) and `zs_unmap_object` (1407 ns), a gap of 440 ns. This suggests the operation between these points (likely the actual data read/decompression within `__zram_bvec_read.constprop.0`) was the most time-consuming part of the sequence.
### Interpretation
This trace provides a fine-grained view of the kernel's path when reading a page from a zram-backed swap device. The sequence reveals the layered nature of the operation:
1. **Initiation:** The process starts at the swap subsystem (`swap_readpage`).
2. **Routing:** It determines the page's location (`__page_file_index`) and routes the request to the block layer (`bdev_read_page`, `blk_queue_enter`).
3. **Compression Handling:** The request is then handled by the zram driver (`zram_rw_page`), which uses the zsmalloc memory allocator (`zs_map_object`, `zs_unmap_object`) to manage the compressed data.
4. **Accounting:** Throughout the process, I/O statistics are tracked (`generic_start/end_io_acct`, `update_io_ticks`).
5. **Completion:** Finally, the page I/O is completed (`page_endio`) and the page is unlocked (`unlock_page`).
The data demonstrates the overhead of traversing multiple kernel layers for a single page read. The significant time spent in the zram/zsmalloc section highlights the computational cost of on-the-fly decompression. This type of trace is invaluable for performance analysis, helping developers identify bottlenecks (like the 440 ns segment) in complex I/O paths. The non-linear time increments show that not all function calls contribute equally to the total latency.