## Line Graphs: Eigenvalue and Effective Dimension Trends
### Overview
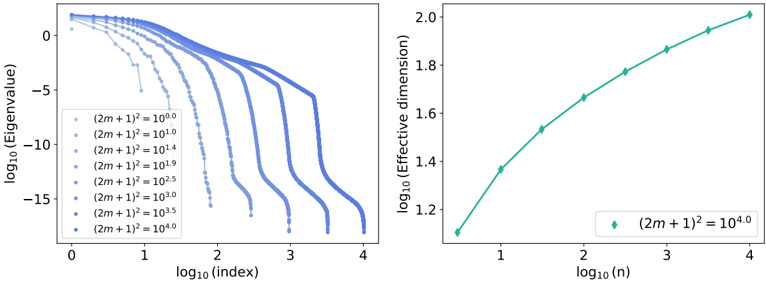
The image contains two line graphs. The left graph displays multiple decaying curves representing eigenvalue magnitudes across logarithmic indices, while the right graph shows a monotonic increase in effective dimension with logarithmic sample size. Both axes use logarithmic scales, and all data points are plotted with distinct markers and colors.
### Components/Axes
**Left Graph (Eigenvalues):**
- **X-axis**: `log₁₀(index)` ranging from 0 to 4
- **Y-axis**: `log₁₀(eigenvalue)` ranging from -15 to 0
- **Legend**: Seven curves labeled with `(2m + 1)² = 10^k` where `k ∈ {0.0, 1.0, 1.4, 1.9, 2.5, 3.0, 3.5, 4.0}`
- **Markers**: Blue circles (○) for all curves
**Right Graph (Effective Dimension):**
- **X-axis**: `log₁₀(n)` ranging from 1 to 4
- **Y-axis**: `log₁₀(effective dimension)` ranging from 1.2 to 2.0
- **Legend**: Single curve labeled `(2m + 1)² = 10⁴.⁰`
- **Markers**: Green diamonds (♦)
### Detailed Analysis
**Left Graph Trends:**
1. All curves start near `log₁₀(eigenvalue) ≈ 0` at `log₁₀(index) = 0`
2. Sharp decline occurs between `log₁₀(index) = 0.5–1.5`
3. Plateau phase begins at `log₁₀(index) ≈ 2.0`, with eigenvalues stabilizing near:
- `k = 0.0`: -5
- `k = 1.0`: -8
- `k = 1.4`: -10
- `k = 1.9`: -12
- `k = 2.5`: -14
- `k = 3.0`: -15
- `k = 3.5`: -15
- `k = 4.0`: -15
**Right Graph Trends:**
1. Linear increase from `(log₁₀(n), log₁₀(eff dim)) = (1, 1.3)` to `(4, 2.0)`
2. Slope ≈ 0.25 per unit increase in `log₁₀(n)`
3. All points follow a perfect linear relationship with no scatter
### Key Observations
1. **Eigenvalue Decay**: Higher `(2m + 1)²` values (larger `k`) show steeper initial decay but similar plateau magnitudes
2. **Effective Dimension Growth**: Perfect linear relationship between `log₁₀(n)` and `log₁₀(eff dim)` suggests power-law scaling
3. **Consistency Check**: The right graph's `(2m + 1)² = 10⁴.⁰` matches the left graph's steepest decay curve (k=4.0), implying parameter coupling
### Interpretation
The left graph demonstrates that eigenvalues decay exponentially with index, with decay severity controlled by `(2m + 1)²`. The right graph reveals that effective dimension grows logarithmically with sample size `n`, following a strict power-law relationship. The matching `(2m + 1)² = 10⁴.⁰` parameter in both graphs suggests these metrics are interconnected through the same underlying system parameterization. The perfect linearity in the right graph indicates no noise or variability in the effective dimension measurement, implying either idealized conditions or deterministic system behavior.