## Scatter Plot: Astronomy Confidence vs. Target Length
### Overview
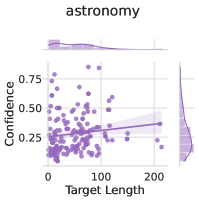
The image is a scatter plot showing the relationship between "Confidence" and "Target Length" for the category "astronomy". The plot includes marginal density plots along the top and right edges, and a regression line with a confidence interval. The data points are clustered, and the regression line suggests a slightly positive correlation.
### Components/Axes
* **Title:** astronomy
* **X-axis:** Target Length
* Scale: 0 to 200, with tick marks at 0, 100, and 200.
* **Y-axis:** Confidence
* Scale: 0 to 0.75, with tick marks at 0, 0.25, 0.50, and 0.75.
* **Data Points:** Represented by purple circles.
* **Regression Line:** A purple line showing the linear relationship between Target Length and Confidence.
* **Confidence Interval:** A shaded purple region around the regression line, indicating the uncertainty in the line's position.
* **Marginal Density Plots:**
* Top: Density plot of Target Length.
* Right: Density plot of Confidence.
### Detailed Analysis
* **Data Point Distribution:** The data points are concentrated in the lower-left region of the plot, indicating that most data points have low Target Length and low Confidence.
* **Regression Line:** The regression line has a slight positive slope, suggesting a weak positive correlation between Target Length and Confidence.
* **Confidence Interval:** The confidence interval is relatively wide, indicating a high degree of uncertainty in the regression line's position.
* **Marginal Density Plots:**
* Target Length: The density plot shows that the Target Length is skewed to the right, with most values clustered around 0.
* Confidence: The density plot shows that the Confidence is bimodal, with peaks around 0.25 and 0.5.
### Key Observations
* There is a weak positive correlation between Target Length and Confidence.
* Most data points have low Target Length and low Confidence.
* There is a high degree of uncertainty in the regression line's position.
### Interpretation
The scatter plot suggests that there is a weak positive relationship between the length of the target and the confidence level in the "astronomy" category. However, the wide confidence interval and the concentration of data points in the lower-left region indicate that this relationship is not strong. The bimodal distribution of the Confidence values suggests that there may be two distinct groups of data points with different confidence levels. The skewness of the Target Length distribution suggests that most targets are relatively short.