## Scatter Plot with Marginal Distributions: Astronomy Confidence vs. Target Length
### Overview
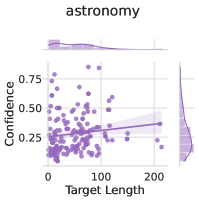
The image is a statistical visualization, specifically a scatter plot with marginal distribution plots (histograms/density plots) on the top and right sides. The chart is titled "astronomy" and explores the relationship between "Target Length" and "Confidence." The data is presented in a monochromatic purple color scheme against a light grey grid background.
### Components/Axes
* **Title:** "astronomy" (centered at the top).
* **X-Axis (Main Plot):** Labeled "Target Length." The scale runs from 0 to 200, with major tick marks at 0, 100, and 200.
* **Y-Axis (Main Plot):** Labeled "Confidence." The scale runs from 0.00 to 0.75, with major tick marks at 0.00, 0.25, 0.50, and 0.75.
* **Data Series:** A scatter of individual data points (purple circles) and a fitted regression line (solid purple line) with a shaded confidence interval band (lighter purple).
* **Marginal Plots:**
* **Top Marginal Plot:** Aligned with the X-axis. It shows the distribution of the "Target Length" variable. The shape suggests a right-skewed distribution, with the highest density near 0 and a long tail extending towards 200.
* **Right Marginal Plot:** Aligned with the Y-axis. It shows the distribution of the "Confidence" variable. The shape suggests a distribution peaked around 0.25-0.35, with a tail extending towards higher confidence values.
* **Legend:** No explicit legend is present. The color purple is used consistently for all data elements (points, line, interval, marginal plots).
### Detailed Analysis
* **Data Point Distribution:** The scatter plot contains approximately 80-100 data points. The points are most densely clustered in the lower-left quadrant, where both Target Length (0-100) and Confidence (0.00-0.50) are relatively low.
* **Trend Verification:** The fitted regression line shows a clear, positive linear trend. It slopes upward from left to right, indicating that as Target Length increases, Confidence tends to increase as well.
* **Approximate Regression Line Values:**
* The line appears to start near a Confidence value of **~0.25** at a Target Length of **0**.
* It ends near a Confidence value of **~0.45** at a Target Length of **200**.
* **Confidence Interval:** The shaded band around the regression line represents the uncertainty of the fit. The band is narrower in the region of high data density (low Target Length) and widens considerably as Target Length increases beyond ~150, indicating greater uncertainty in the trend for longer targets due to sparser data.
* **Marginal Distribution Details:**
* **Target Length (Top):** The distribution is heavily concentrated between 0 and 50, with a significant drop-off after 100. A very small number of points exist near 200.
* **Confidence (Right):** The distribution is unimodal, with the highest density between approximately 0.20 and 0.40. The density decreases steadily for values above 0.50.
### Key Observations
1. **Positive Correlation:** There is a visually evident positive correlation between the length of a target (in an astronomy context) and the confidence associated with it.
2. **Data Sparsity at Extremes:** The dataset is heavily skewed towards shorter target lengths. Very few observations exist for targets longer than 150 units.
3. **Heteroscedasticity:** The spread (variance) of the Confidence values appears to increase with Target Length. This is visually suggested by the widening scatter of points and confirmed by the flaring confidence interval band on the regression line.
4. **Outliers:** A few notable outliers exist. For example, there are points with relatively high Confidence (>0.60) at moderate Target Lengths (~50-100), and at least one point with very low Confidence (<0.10) at a Target Length near 100.
### Interpretation
The data suggests that in the context of this "astronomy" dataset, **longer targets are associated with higher confidence levels.** This could imply several investigative scenarios:
* **Signal Strength:** Longer observation targets (e.g., longer exposure times, larger celestial objects, or extended phenomena) may yield stronger or more reliable signals, leading to higher confidence in measurements or classifications.
* **Data Quality:** The process of measuring or analyzing longer targets might be inherently more robust or less prone to error.
* **Selection Bias:** The pronounced skew in the Target Length distribution indicates the dataset is not uniform. The preponderance of short targets might reflect observational constraints (e.g., most detectable objects are small/short) or a sampling bias in the study design. The positive trend must be interpreted with caution, as it is driven by a relatively small number of long-target data points.
* **Predictive Uncertainty:** The widening confidence interval for longer targets is a critical finding. It means that while the *average* confidence increases with length, the *predictability* of confidence for any single long target is low. This highlights a key area for further investigation: understanding what factors cause high variance in confidence for longer targets.
**In summary, the chart demonstrates a clear positive relationship but also reveals important limitations in the data distribution and predictive certainty, which are essential for any technical or scientific conclusion drawn from it.**