## Scatter Plot: Astronomy - Confidence vs. Target Length
### Overview
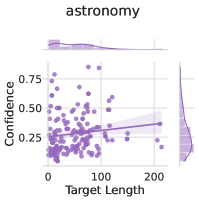
The image is a scatter plot titled "astronomy" with a line of best fit and a shaded confidence interval. The x-axis represents "Target Length" (0–200), and the y-axis represents "Confidence" (0.25–0.75). Purple data points are scattered across the plot, with a blue line of best fit and a light blue shaded confidence interval.
### Components/Axes
- **Title**: "astronomy" (top-center).
- **X-axis**: "Target Length" (0–200, labeled in increments of 100).
- **Y-axis**: "Confidence" (0.25–0.75, labeled in increments of 0.25).
- **Legend**:
- **Line of Best Fit**: Blue (top-right corner).
- **Confidence Interval**: Light blue (top-right corner).
- **Data Points**: Purple dots distributed across the plot.
### Detailed Analysis
- **Line of Best Fit**:
- Slope: Approximately 0.003 (positive trend).
- Equation: Confidence ≈ 0.003 × Target Length + 0.25 (estimated from intercept and slope).
- Position: Passes through the center of the data distribution.
- **Confidence Interval**:
- Width: Narrower at higher Target Length values (e.g., ~0.05 at Target Length 200 vs. ~0.15 at Target Length 0).
- Position: Centered on the line of best fit.
- **Data Points**:
- Distribution: Scattered but clustered around the line of best fit.
- Outliers: A few points deviate significantly (e.g., Confidence ~0.75 at Target Length ~50).
### Key Observations
1. **Positive Correlation**: Confidence increases with Target Length (line of best fit slope > 0).
2. **Confidence Interval Shape**: Narrower at higher Target Length values, suggesting more precise estimates.
3. **Data Spread**: Most points lie below the line of best fit, indicating variability or potential outliers.
### Interpretation
The plot demonstrates a **positive relationship** between Target Length and Confidence, with Confidence increasing by ~0.003 per unit increase in Target Length. The narrowing confidence interval at higher Target Length values suggests improved model reliability for larger targets. However, the spread of data points below the line (e.g., Confidence ~0.25–0.35 at Target Length ~50) highlights potential variability or unaccounted factors affecting Confidence. The shaded interval’s asymmetry (wider at lower Target Lengths) implies greater uncertainty in predictions for smaller targets. This could reflect challenges in data collection or model limitations for low-Target Length scenarios.