## Bar Chart: Effective Efficiency Comparison
### Overview
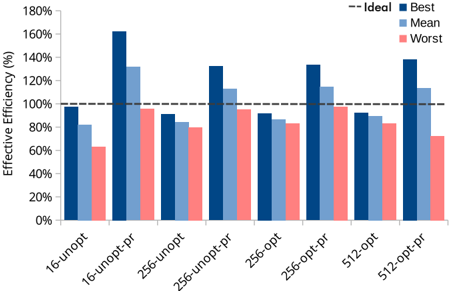
The image is a bar chart comparing the effective efficiency (%) of different configurations. The x-axis represents various configurations (16-unopt, 16-unopt-pr, 256-unopt, 256-unopt-pr, 256-opt, 256-opt-pr, 512-opt, 512-opt-pr), and the y-axis represents the effective efficiency in percentage, ranging from 0% to 180%. For each configuration, there are three bars representing the "Best", "Mean", and "Worst" efficiency. A dashed horizontal line indicates the "Ideal" efficiency at 100%.
### Components/Axes
* **X-axis:** Configuration types: 16-unopt, 16-unopt-pr, 256-unopt, 256-unopt-pr, 256-opt, 256-opt-pr, 512-opt, 512-opt-pr.
* **Y-axis:** Effective Efficiency (%), ranging from 0% to 180% in increments of 20%.
* **Legend (top-right):**
* "-- Ideal": Dashed black line at 100% efficiency.
* "Best": Dark blue bars.
* "Mean": Light blue bars.
* "Worst": Light red bars.
### Detailed Analysis
Here's a breakdown of the efficiency values for each configuration:
* **16-unopt:**
* Best: ~98%
* Mean: ~82%
* Worst: ~63%
* **16-unopt-pr:**
* Best: ~160%
* Mean: ~132%
* Worst: ~95%
* **256-unopt:**
* Best: ~92%
* Mean: ~84%
* Worst: ~82%
* **256-unopt-pr:**
* Best: ~132%
* Mean: ~112%
* Worst: ~92%
* **256-opt:**
* Best: ~92%
* Mean: ~88%
* Worst: ~82%
* **256-opt-pr:**
* Best: ~132%
* Mean: ~102%
* Worst: ~78%
* **512-opt:**
* Best: ~92%
* Mean: ~90%
* Worst: ~72%
* **512-opt-pr:**
* Best: ~134%
* Mean: ~114%
* Worst: ~94%
### Key Observations
* The "Best" efficiency is consistently higher than the "Mean" and "Worst" efficiencies for all configurations.
* Configurations with "-pr" (likely indicating a specific optimization or parameter) generally show significantly higher "Best" and "Mean" efficiencies compared to their counterparts without "-pr".
* The "Worst" efficiency is generally the lowest across all configurations.
* The "16-unopt-pr" configuration has the highest "Best" efficiency, exceeding 160%.
* The "Best" efficiency for "16-unopt-pr", "256-unopt-pr", "256-opt-pr", and "512-opt-pr" exceeds the "Ideal" efficiency of 100%.
### Interpretation
The data suggests that the "-pr" configurations provide a significant boost in effective efficiency, as evidenced by the higher "Best" and "Mean" values. This indicates that the optimization or parameter represented by "-pr" is highly effective in improving performance. The "Worst" efficiency values highlight the variability in performance, even with the "-pr" optimization. The "16-unopt-pr" configuration stands out as the most efficient, achieving the highest "Best" efficiency among all configurations. The configurations without "-pr" hover around the ideal efficiency, with the "Worst" case being significantly lower.