## Bar Chart: Effective Efficiency Comparison
### Overview
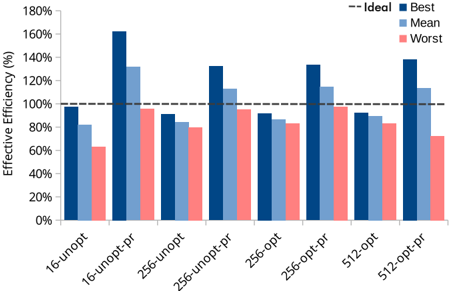
This bar chart compares the "Effective Efficiency (%)" of different configurations, labeled as "16-unopt", "16-opt-pr", "256-unopt", "256-unopt-pr", "256-opt", "256-opt-pr", "512-opt", and "512-opt-pr". For each configuration, three bars represent the "Best", "Mean", and "Worst" efficiency values. A horizontal dashed line indicates the "Ideal" efficiency level of 100%.
### Components/Axes
* **X-axis:** Configuration names: "16-unopt", "16-opt-pr", "256-unopt", "256-unopt-pr", "256-opt", "256-opt-pr", "512-opt", "512-opt-pr".
* **Y-axis:** "Effective Efficiency (%)", ranging from 0% to 180%.
* **Legend:**
* Dark Blue: "Best"
* Medium Blue: "Mean"
* Light Red: "Worst"
* **Ideal Line:** A horizontal dashed black line at 100% representing the ideal efficiency.
### Detailed Analysis
The chart consists of eight groups of three bars, one for each configuration. I will analyze each configuration individually, noting the approximate values for each bar.
* **16-unopt:**
* Best: ~155%
* Mean: ~95%
* Worst: ~75%
* **16-opt-pr:**
* Best: ~160%
* Mean: ~130%
* Worst: ~90%
* **256-unopt:**
* Best: ~130%
* Mean: ~80%
* Worst: ~70%
* **256-unopt-pr:**
* Best: ~135%
* Mean: ~100%
* Worst: ~80%
* **256-opt:**
* Best: ~140%
* Mean: ~105%
* Worst: ~85%
* **256-opt-pr:**
* Best: ~130%
* Mean: ~115%
* Worst: ~90%
* **512-opt:**
* Best: ~145%
* Mean: ~120%
* Worst: ~90%
* **512-opt-pr:**
* Best: ~145%
* Mean: ~110%
* Worst: ~80%
### Key Observations
* The "Best" efficiency consistently exceeds 100% for all configurations, indicating potential for optimization beyond the ideal.
* The "Worst" efficiency is generally lower than the "Mean" efficiency, showing variability in performance.
* Configurations with "opt-pr" generally have higher "Mean" and "Best" efficiencies than their "unopt" counterparts.
* The "16-opt-pr" configuration exhibits the highest "Best" efficiency, while "256-unopt" has the lowest.
* The "Mean" efficiency values tend to cluster around the 100% mark, with some configurations exceeding it.
### Interpretation
The data suggests that optimization techniques ("opt" and "opt-pr") generally improve the effective efficiency of the configurations. The "opt-pr" configurations consistently outperform their "unopt" counterparts, indicating the benefit of the "pr" optimization. The significant difference between "Best" and "Worst" efficiency highlights the importance of considering performance variability. The fact that "Best" efficiency exceeds 100% suggests that the configurations can be optimized to perform better than the defined "Ideal" level. The configurations with larger sizes (512) show a trend of higher "Best" efficiency, but also a wider range between "Best" and "Worst" performance. This could indicate that larger configurations offer more potential for optimization but also require more careful tuning to avoid performance degradation. The chart provides a comparative analysis of different configurations, allowing for informed decisions about which configurations to prioritize based on desired efficiency levels and performance consistency.