## Network Diagrams: Simple vs. Complex Topologies
### Overview
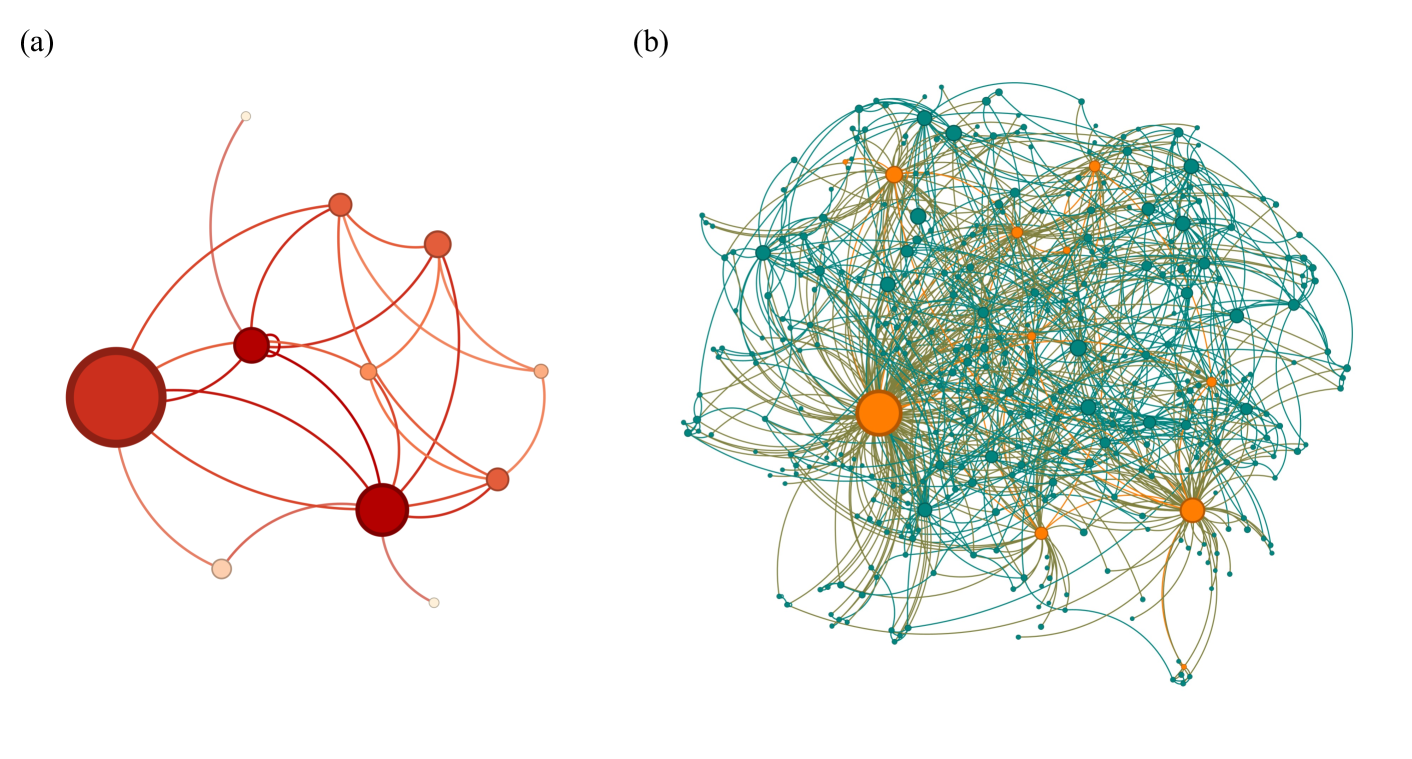
The image displays two side-by-side network graphs, labeled (a) on the left and (b) on the right. These diagrams visually represent relationships (edges) between various entities (nodes). The image serves as a comparative illustration, contrasting a highly simplified, sparse network (a) with a highly complex, dense, and multi-categorical network (b).
**Crucial Note on Data Extraction:** The image does not contain any explicit data tables, axes, scales, or legends. Aside from the structural labels "(a)" and "(b)", there is no text. Therefore, exact numerical facts or specific categorical data cannot be extracted. The following analysis relies on visual encodings (size, color, density, and topology) to infer the underlying data structure.
### Components/Legend (Inferred)
Because no explicit legend is provided, the visual variables must be deduced:
* **Text Labels:**
* `(a)` located at the top-left corner of the left diagram.
* `(b)` located at the top-left corner of the right diagram.
* **Nodes (Circles):** Represent individual entities or data points.
* *Size:* Varies significantly in both diagrams. This almost certainly represents a quantitative metric, most likely "degree centrality" (the number of connections a node has) or a specific weight/importance assigned to the entity.
* *Color:* Represents either a continuous variable (gradient) or categorical data (distinct groups).
* **Edges (Lines):** Represent relationships, interactions, or pathways between nodes. They are drawn as curved lines to visually separate overlapping connections.
---
### Content Details
#### Region 1: Diagram (a) - Left Side
* **Visual Trend/Layout:** This is a sparse, localized network with a clear hub-and-spoke tendency. The layout is relatively open, allowing every individual connection to be traced visually.
* **Node Characteristics:**
* **Count:** Exactly 10 nodes are visible.
* **Color Palette:** A sequential, monochromatic gradient ranging from pale peach/pink to deep, dark red.
* **Size & Placement:**
* One massive node (bright red with a dark red outline) is positioned on the far-left edge of the cluster.
* Two medium-large nodes (dark red) are positioned centrally and toward the bottom-right.
* Seven smaller nodes (lighter peach/pink) are scattered around the periphery (top, far right, bottom).
* **Correlation:** There appears to be a direct correlation between node size and color darkness; larger nodes are darker red, while smaller nodes are lighter.
* **Edge Characteristics:**
* The lines are relatively thin and colored in reddish hues that generally match the nodes they connect.
* The massive node on the left connects directly to the two medium-large nodes and several smaller ones.
* There are no isolated nodes; all are part of a single connected component.
#### Region 2: Diagram (b) - Right Side
* **Visual Trend/Layout:** This is a highly dense, complex "hairball" network. It exhibits a clustered, force-directed layout where highly connected nodes are pulled toward the center, creating a massive tangle of overlapping edges.
* **Node Characteristics:**
* **Count:** Hundreds of nodes (estimated 200-300+).
* **Color Palette:** A diverging/categorical palette consisting of two distinct colors: Teal (dark cyan) and Orange.
* **Size & Placement:**
* *Orange Nodes:* Represent a minority in count but include the most prominent hubs. There are two exceptionally large orange nodes (one in the lower-left-center, one in the lower-right). There are approximately 8-10 medium-sized orange nodes scattered throughout the upper and central regions.
* *Teal Nodes:* Represent the vast majority of the nodes. They range from medium-small to tiny dots. They form the dense "cloud" that makes up the bulk of the network.
* **Edge Characteristics:**
* The edges are extremely dense, making it impossible to trace individual paths through the center of the mass.
* Edge colors correspond to the nodes: Teal lines connect teal nodes, while brownish/orange lines connect to the orange nodes.
* The large orange nodes act as massive gravitational centers (super-hubs), with dozens of brownish edges radiating outward from them to other parts of the network.
---
### Key Observations
1. **Scale Contrast:** Diagram (a) represents a micro-level system or a highly filtered dataset, whereas diagram (b) represents a macro-level, systemic dataset.
2. **Color Encoding Shift:** Diagram (a) uses color to represent a gradient (likely tied to the same metric as node size), while diagram (b) uses color to represent two distinct categories or classes of nodes within the same ecosystem.
3. **Hub Dominance:** Both networks rely heavily on "hubs" (the large nodes). However, in (b), the hubs are categorically distinct (orange) from the general population of nodes (teal).
---
### Interpretation
From a Peircean investigative standpoint, reading between the lines of these visual structures suggests this image is likely a figure from a scientific or technical paper demonstrating network topologies.
* **What the data suggests:**
* **Diagram (a)** likely illustrates a simple motif, a localized cluster, or a baseline model. Because size and color correlate, it might represent something like a small social group where the large red node is the central figure, or a localized protein interaction where one protein acts as the primary catalyst.
* **Diagram (b)** represents a complex, real-world system. The presence of two distinct colors (Teal and Orange) strongly suggests a *bipartite network* (e.g., users and products, authors and papers, or two different types of biological cells). Alternatively, it could represent a network where a specific class of nodes (Orange) acts as critical infrastructure or "super-spreaders" within a larger population (Teal).
* **Relationship:** The juxtaposition implies a comparison of scale or methodology. The authors may be showing a zoomed-in sub-network (a) extracted from the larger whole (b), or they may be contrasting a theoretical simple model (a) against empirical, messy real-world data (b).
* **Vulnerabilities:** Visually, network (b) appears highly dependent on the two massive orange hubs in the lower hemisphere. If this were a power grid or a computer network, taking out those two specific orange nodes would likely cause massive fragmentation of the teal nodes, demonstrating a system that is highly connected but potentially fragile to targeted attacks.