## Network Diagrams: (a) Simplified Hierarchical Network, (b) Complex Interconnected System
### Overview
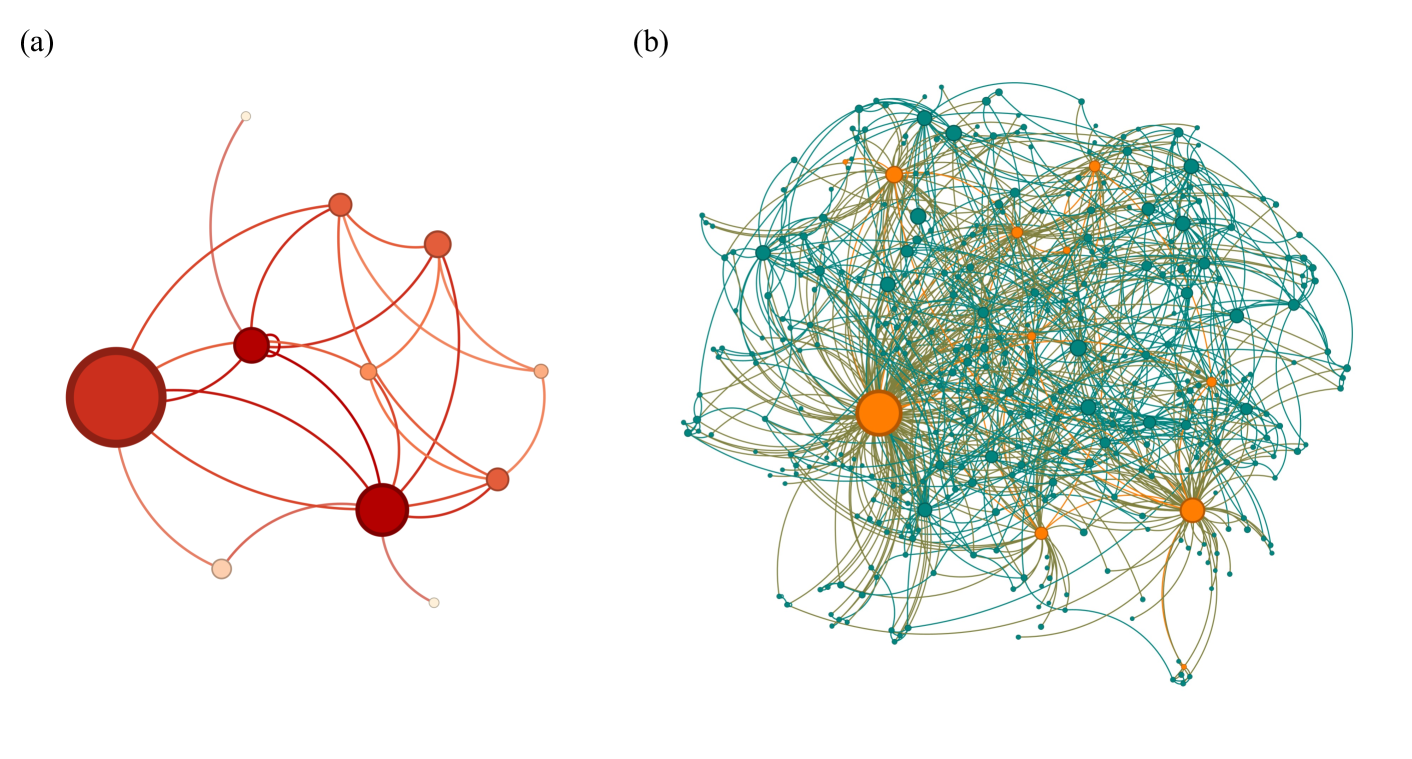
The image contains two network diagrams labeled (a) and (b). Diagram (a) depicts a small-scale network with a central hub and peripheral nodes, while diagram (b) shows a large, densely interconnected system with multiple hubs. Both diagrams use nodes (circles) and edges (lines) to represent relationships, but differ in scale, complexity, and node distribution.
### Components/Axes
- **Diagram (a)**:
- **Nodes**:
- 1 large dark red node (left-center).
- 2 medium red nodes (connected to the central hub).
- 3 smaller red nodes (peripheral, connected to medium nodes).
- 2 white nodes (isolated or weakly connected).
- **Edges**:
- Thick red lines between central and medium nodes.
- Thinner red lines between medium and peripheral nodes.
- No explicit legend or axis labels.
- **Spatial Layout**:
- Central hub dominates the left side.
- Peripheral nodes radiate outward in a star-like pattern.
- **Diagram (b)**:
- **Nodes**:
- 3 large orange nodes (potential hubs, distributed across the network).
- Numerous smaller teal nodes (peripheral or secondary nodes).
- **Edges**:
- Dense, overlapping teal and orange lines.
- No explicit legend or axis labels.
- **Spatial Layout**:
- Nodes are clustered in overlapping regions.
- Orange hubs are positioned at the top-left, center, and bottom-right.
### Detailed Analysis
- **Diagram (a)**:
- The central dark red node acts as a primary hub, with 2 medium red nodes serving as intermediaries.
- Peripheral nodes (smaller red and white) are sparsely connected, suggesting a hierarchical structure.
- No explicit labels or axis markers; scale is implied by node size.
- **Diagram (b)**:
- The 3 orange hubs are highly connected, with teal nodes forming a dense mesh.
- Edges are tangled, indicating high interconnectivity and potential redundancy.
- No explicit labels or axis markers; scale is implied by node density.
### Key Observations
1. **Scale and Complexity**:
- Diagram (a) represents a small, structured network (e.g., organizational hierarchy).
- Diagram (b) represents a large, chaotic system (e.g., social network or neural network).
2. **Node Distribution**:
- Diagram (a) has a clear central authority (dark red node).
- Diagram (b) has distributed hubs (orange nodes), suggesting decentralized control.
3. **Edge Density**:
- Diagram (a) has sparse, directional edges.
- Diagram (b) has dense, overlapping edges, implying high interaction frequency.
### Interpretation
- **Diagram (a)** likely models a controlled, top-down system where the central hub dictates interactions. The peripheral nodes may represent end-users or subordinate entities.
- **Diagram (b)** suggests a self-organizing system with multiple influential nodes (orange hubs). The dense connectivity could indicate resilience but also potential for chaos or inefficiency.
- **Notable Anomalies**:
- Diagram (a) includes 2 isolated white nodes, which may represent disconnected components or errors in the network.
- Diagram (b) lacks clear hierarchical structure, contrasting with diagram (a).
- **Implications**:
- Diagram (a) emphasizes simplicity and control, suitable for small-scale systems.
- Diagram (b) reflects real-world complexity, where multiple hubs compete or collaborate, requiring adaptive management.
**Note**: The diagrams contain no textual labels, legends, or axis markers. All interpretations are based on visual structure and relative positioning.