## Chart: Logarithmic Growth of Calls vs. Clauses
### Overview
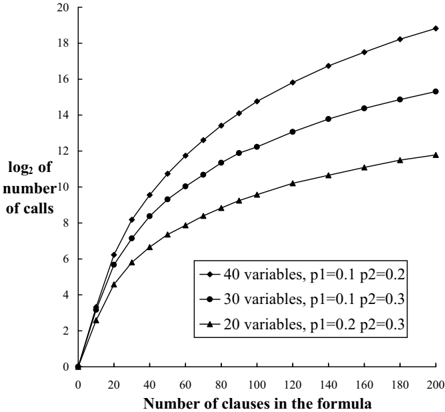
The image is a line chart that depicts the relationship between the number of clauses in a formula and the base-2 logarithm of the number of calls, for different numbers of variables and probabilities p1 and p2. The chart shows three distinct lines, each representing a different configuration of variables and probabilities.
### Components/Axes
* **X-axis:** "Number of clauses in the formula". The scale ranges from 0 to 200, with tick marks every 20 units.
* **Y-axis:** "log2 of number of calls". The scale ranges from 0 to 20, with tick marks every 2 units.
* **Legend (bottom-right):**
* Line with diamonds: "40 variables, p1=0.1 p2=0.2"
* Line with circles: "30 variables, p1=0.1 p2=0.3"
* Line with triangles: "20 variables, p1=0.2 p2=0.3"
### Detailed Analysis
* **40 variables, p1=0.1 p2=0.2 (Diamonds):**
* The line starts at approximately (0, 0).
* At 20 clauses, the log2 of calls is approximately 6.
* At 60 clauses, the log2 of calls is approximately 11.
* At 100 clauses, the log2 of calls is approximately 13.
* At 140 clauses, the log2 of calls is approximately 15.
* At 180 clauses, the log2 of calls is approximately 16.
* At 200 clauses, the log2 of calls is approximately 16.5.
* Trend: The line slopes upward, with the slope decreasing as the number of clauses increases.
* **30 variables, p1=0.1 p2=0.3 (Circles):**
* The line starts at approximately (0, 0).
* At 20 clauses, the log2 of calls is approximately 5.
* At 60 clauses, the log2 of calls is approximately 9.
* At 100 clauses, the log2 of calls is approximately 11.
* At 140 clauses, the log2 of calls is approximately 12.
* At 180 clauses, the log2 of calls is approximately 13.
* At 200 clauses, the log2 of calls is approximately 13.5.
* Trend: The line slopes upward, with the slope decreasing as the number of clauses increases.
* **20 variables, p1=0.2 p2=0.3 (Triangles):**
* The line starts at approximately (0, 0).
* At 20 clauses, the log2 of calls is approximately 4.
* At 60 clauses, the log2 of calls is approximately 7.
* At 100 clauses, the log2 of calls is approximately 8.5.
* At 140 clauses, the log2 of calls is approximately 9.5.
* At 180 clauses, the log2 of calls is approximately 10.5.
* At 200 clauses, the log2 of calls is approximately 11.5.
* Trend: The line slopes upward, with the slope decreasing as the number of clauses increases.
### Key Observations
* All three lines start at the origin (0,0).
* The line representing "40 variables, p1=0.1 p2=0.2" consistently has the highest log2 of calls for any given number of clauses.
* The line representing "20 variables, p1=0.2 p2=0.3" consistently has the lowest log2 of calls for any given number of clauses.
* All three lines show a decreasing rate of increase as the number of clauses increases, suggesting a logarithmic relationship.
### Interpretation
The chart illustrates how the number of variables and the probabilities p1 and p2 affect the number of calls (on a log2 scale) as the number of clauses in a formula increases. The data suggests that increasing the number of variables while keeping p1 and p2 relatively low (40 variables, p1=0.1, p2=0.2) results in a higher number of calls compared to scenarios with fewer variables or different probability combinations. The logarithmic trend indicates that the impact of adding more clauses diminishes as the number of clauses grows larger. The probabilities p1 and p2 seem to have an inverse relationship with the number of variables.