## Line Chart: Computational Complexity Scaling
### Overview
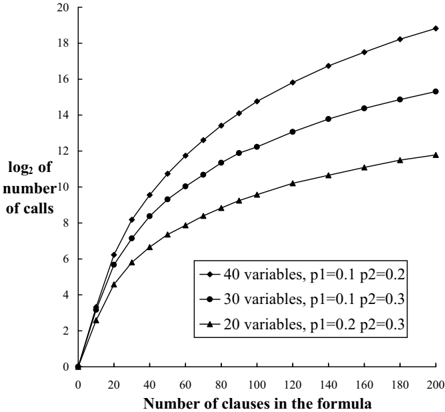
The image is a line chart plotting the base-2 logarithm of the number of calls (y-axis) against the number of clauses in a formula (x-axis). It compares three different problem configurations, each defined by a specific number of variables and two probability parameters (p1 and p2). All three curves demonstrate a sub-linear, concave-downward growth pattern on this semi-logarithmic plot.
### Components/Axes
* **X-Axis:** Labeled "Number of clauses in the formula". It is a linear scale with major tick marks at intervals of 20, ranging from 0 to 200.
* **Y-Axis:** Labeled "log₂ of number of calls". It is a linear scale with major tick marks at intervals of 2, ranging from 0 to 20.
* **Legend:** Located in the bottom-right quadrant of the chart area. It contains three entries, each associating a line/marker style with a specific configuration:
1. **Diamond marker (◆):** "40 variables, p1=0.1 p2=0.2"
2. **Circle marker (●):** "30 variables, p1=0.1 p2=0.3"
3. **Triangle marker (▲):** "20 variables, p1=0.2 p2=0.3"
* **Data Series:** Three distinct lines, each with markers at data points corresponding to x-values of approximately 0, 10, 20, 30, 40, 50, 60, 80, 100, 120, 140, 160, 180, and 200.
### Detailed Analysis
**Trend Verification:** All three data series exhibit a similar visual trend: they start at the origin (0,0) and rise steeply for low clause counts, with the rate of increase gradually diminishing as the number of clauses grows, resulting in a concave-down shape.
**Data Point Extraction (Approximate Values):**
* **Series 1 (40 variables, p1=0.1, p2=0.2 - Diamond ◆):** This is the topmost curve.
* (0, 0), (~10, 3.2), (~20, 5.8), (~30, 7.5), (~40, 8.8), (~50, 9.8), (~60, 10.7), (~80, 12.1), (~100, 13.3), (~120, 14.2), (~140, 15.0), (~160, 15.7), (~180, 16.3), (~200, 16.8)
* **Series 2 (30 variables, p1=0.1, p2=0.3 - Circle ●):** This is the middle curve.
* (0, 0), (~10, 2.8), (~20, 5.0), (~30, 6.5), (~40, 7.6), (~50, 8.5), (~60, 9.2), (~80, 10.4), (~100, 11.3), (~120, 12.0), (~140, 12.6), (~160, 13.1), (~180, 13.5), (~200, 13.9)
* **Series 3 (20 variables, p1=0.2, p2=0.3 - Triangle ▲):** This is the bottom curve.
* (0, 0), (~10, 2.5), (~20, 4.5), (~30, 5.8), (~40, 6.8), (~50, 7.5), (~60, 8.1), (~80, 9.0), (~100, 9.7), (~120, 10.2), (~140, 10.6), (~160, 11.0), (~180, 11.3), (~200, 11.6)
### Key Observations
1. **Hierarchy by Variable Count:** The primary differentiating factor between the curves is the number of variables. The configuration with 40 variables consistently requires the highest number of calls (log₂ scale), followed by 30 variables, and then 20 variables. This ordering is maintained across the entire range of clauses.
2. **Diminishing Returns:** The slope of all curves decreases as the number of clauses increases. The initial growth from 0 to ~40 clauses is very steep, after which the curves begin to flatten, suggesting that the marginal increase in computational cost (log₂ calls) per additional clause becomes smaller for larger formulas.
3. **Parameter Influence:** While variable count is the dominant factor, the probability parameters (p1, p2) also differ between series. The series with the highest variable count (40) has the lowest p1 (0.1) and a mid-range p2 (0.2). Isolating the effect of p1/p2 is difficult without controlled comparisons, but the chart suggests their impact is secondary to the number of variables.
### Interpretation
This chart visualizes the scaling behavior of an algorithm or process whose cost is measured in the number of calls, plotted on a logarithmic scale. The key insight is that the computational complexity grows **exponentially** with the number of clauses (since log₂(calls) increases linearly with clauses would imply calls = 2^(k*clauses)), but the exponent itself depends heavily on the number of variables in the problem.
The data suggests that for this specific process, **problem size (number of variables) is a more critical determinant of computational cost than the number of logical clauses** within the formula, especially as the clause count becomes large. The concave shape indicates that while cost always increases with more clauses, the *rate* of exponential growth slows down. This could be due to algorithmic optimizations, problem structure, or the nature of the search space being explored. The chart effectively communicates that scaling up the number of variables in a problem leads to a dramatically steeper increase in resource requirements compared to simply adding more clauses to a formula with a fixed, smaller number of variables.